Amazon FBA Profit Margin by Category: The Gap Between "Good" and Actually Valuable
The FBA Guys
March 29, 2026
Every Amazon seller wants a category benchmark because category feels clean. Beauty should have one kind of margin. Home & Garden should have another. Grocery should come with a warning label. Fair enough.
The problem is that category is only the first layer of the answer.
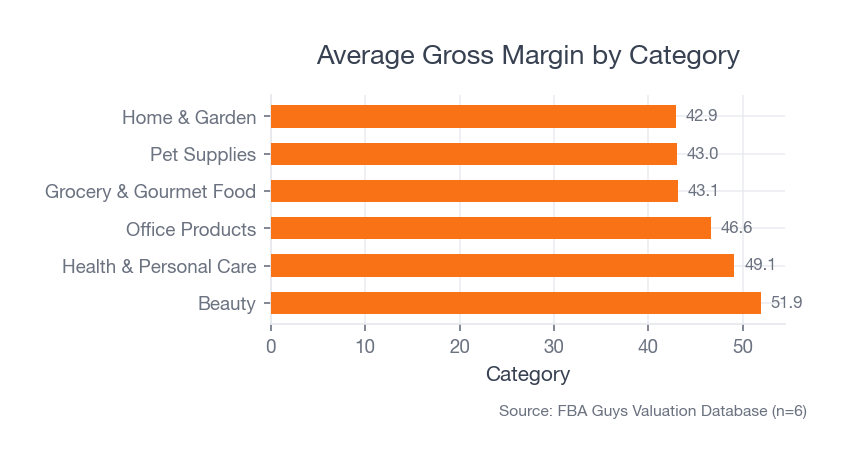
In our database of 8,383 successful FBA valuations, the average business posted a 45.6% gross margin and a 36.9% SDE margin. Looking only at single-category businesses, Beauty averaged 51.9% gross margin, Health & Personal Care 49.1%, and Home & Garden 42.9%. So yes, category changes the range. It just doesn't tell you what survives after the rest of the business gets involved.
If you want the short answer to "Amazon FBA profit margin by category," here it is: higher-margin categories do exist, but the benchmark that matters more is how much of that gross margin still exists after operating expense turns it into SDE. That is the number buyers price.
What "Good" Actually Looks Like
There isn't one good Amazon FBA profit margin.
There is a zone where the business stops looking fragile.
Across all 8,383 successful valuations in our dataset, 4,215 businesses, or 50.3%, came in above 40% gross margin. Another 1,499 sat between 31% and 40%. Only 109 fell below 10%.
That matters because sellers still talk about 40% gross margin like it proves they built something unusual. It doesn't. In this dataset, it is more like the lower boundary of "healthy enough to keep asking better questions."
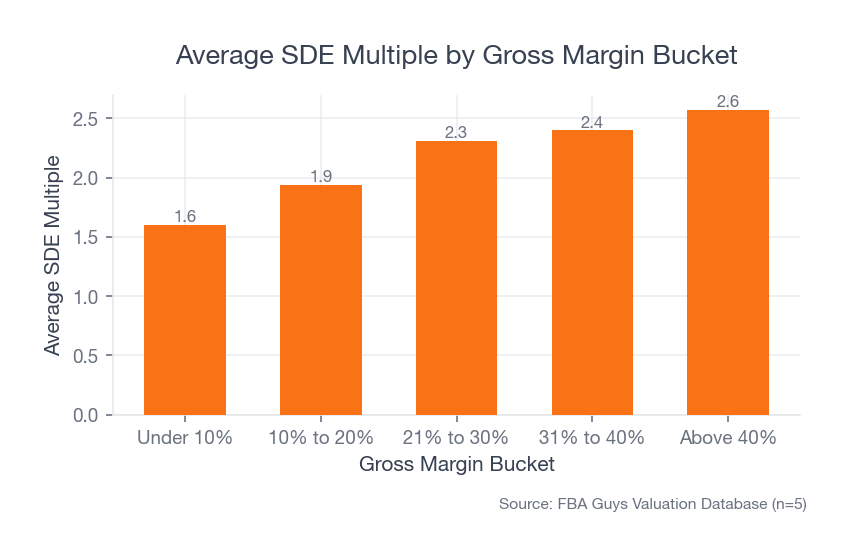
Margin still matters for value. Weak margins get punished. Hard. Businesses under 10% gross margin averaged a 1.60x SDE multiple. Businesses between 10% and 20% averaged 1.94x. At 21% to 30%, the average multiple climbed to 2.31x. Then the premium started to flatten: 31% to 40% averaged 2.40x, while above 40% reached 2.57x.
That flattening matters. Sellers tend to imagine a straight line between higher gross margin and a dramatically better valuation. The data does not support that once the business already looks reasonably healthy.
The fact is, most of the useful margin work happens before you start fantasizing about the premium end of the range. Are you clearing the threshold where the business stops looking brittle? Are you keeping enough of that margin after ad spend, payroll, software, prep, refunds, and the rest of the recurring clutter show up? That is usually the argument, rather than whether 46% should have been 49%.
 Source: FBA Guys Valuation Database (n=8,383)
Our earlier guide to how to calculate Amazon gross margin is useful if you need the product-level math first. This piece is for the next question: what those margins look like when you line them up by category and then ask whether the earnings actually hold.
Margins by Category: Where the Data Surprises You
The category spread is real.
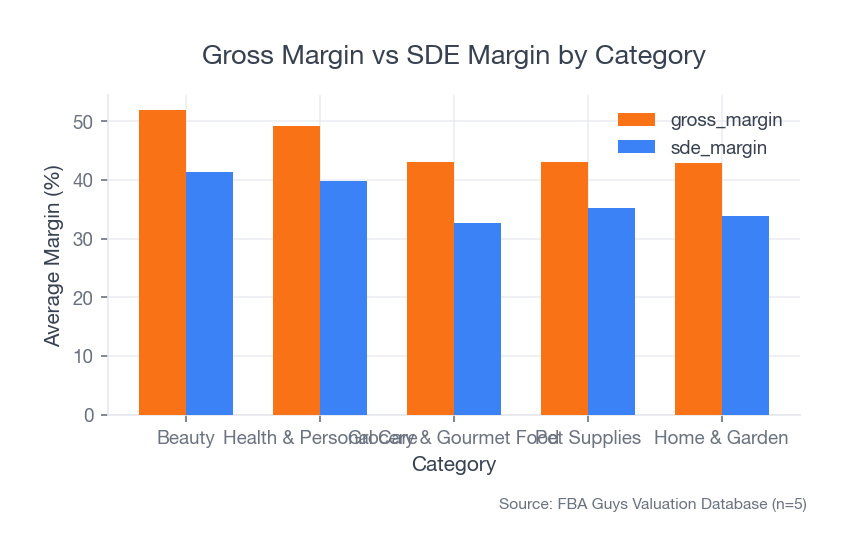
Among single-category businesses with usable sample sizes, Beauty averaged 51.9% gross margin and 41.3% SDE margin. Health & Personal Care averaged 49.1% and 39.8%. Home & Garden averaged 42.9% and 33.9%. Grocery & Gourmet Food averaged 43.1% and 32.7%.
That is a meaningful spread. It just isn't the whole story.
The more interesting part is valuation. Pet Supplies averaged only 43.0% gross margin and still produced a 2.72x average SDE multiple. Health & Personal Care came in at 2.71x. Beauty, despite the strongest gross-margin average in the set, landed at 2.60x.
So the category benchmark helps you set expectations, but it does not settle the pricing question. Buyers are still evaluating concentration, documentation, transferability, and whether the earnings survive contact with diligence.
That is the part category-only articles usually skip because it ruins the neat ranking.
And that neat ranking is exactly what sellers usually want. Tell me the good categories. Tell me the bad ones. Tell me whether mine gets to feel above average before we look at anything annoying. We don't get to do that. A category benchmark can orient you, certainly, but it can't rescue a business whose economics only work because nobody has pushed hard on the expense structure yet.
 Source: FBA Guys Valuation Database (n=4,631 across selected categories)
Gross Margin vs Net Margin vs SDE Margin
This is where sellers get themselves in trouble.
Gross margin tells you what is left after product cost. Net margin tells you what is left after operating expense. SDE margin means Seller's Discretionary Earnings margin, or the share of revenue left for one owner after the business's real recurring costs are accounted for and legitimate add-backs are handled the way a buyer would handle them, rather than the way the seller hoped they might be handled.
The gap between gross margin and SDE margin is where the useful benchmark lives.
Beauty looked strongest in gross margin at 51.9%, but the average Beauty business still gave back 10.7 percentage points before it reached SDE margin. Grocery & Gourmet Food gave back 10.4 points. Home & Garden gave back 9.0. Pet Supplies gave back 7.8.
That means two businesses can post the same gross margin and still be nowhere near each other in owner earnings. One has a tidy operation. The other has a habit of explaining away recurring costs as temporary. Buyers tend to notice.
Gross margin is the easy number to admire. SDE margin is the one that forces the conversation to stay honest.
This is also why "what's a good margin in my category?" is not quite the right question, even though it's the one everyone starts with. A better question is: how much of my category's typical gross margin am I actually keeping once the business behaves like a real operating company instead of a clean spreadsheet?
 Source: FBA Guys Valuation Database (n=3,527 across selected categories)
If you want the ownership-level version of that math, the SDE calculator is the more honest next tool.
Why Revenue Changes the Benchmark
Category advice gets shakier once scale enters the room.
Businesses under $100,000 in annual revenue averaged 50.8% gross margin and 42.8% SDE margin. Businesses above $1 million averaged 42.4% gross margin and 32.4% SDE margin.
That does not mean scaled businesses are weaker. It means complexity is expensive.
More inventory. More advertising. More staff. More tools. More small operational leaks that stop feeling small once they become permanent.
So when a larger seller grabs a category benchmark built from smaller operators and uses it as proof that everything is fine, the benchmark turns into a comforting lie.
This is also why category should not become a personality. A Home & Garden seller with disciplined operating cost can look healthier than a Beauty seller who lets advertising, labor, and cleanup costs sprawl all over the place. The database keeps dragging the conversation back to the same place: category sets the lane, but execution determines how much of the lane you keep.
How to Use Category Benchmarks Without Lying to Yourself
Use category benchmarks to orient, not to absolve.
If you sell in Beauty or Health & Personal Care, a weak gross margin deserves scrutiny because those categories usually give you more room. If you sell in Home & Garden or Grocery, the starting benchmark is tighter, but that does not excuse sloppy operating cost. The job is not to match a category average. The job is to understand whether your margin structure makes sense for your category, your size, and your operational complexity.
Then carry the math forward.
Track gross margin. Track net margin. Then calculate SDE margin the way a buyer would. If that last number compresses harder than you expected, that is not bad luck. That is the diagnosis.
You can think of category as the opening bid, not the closing argument. It tells you what room the business probably had to work with. It doesn't tell you whether that room was used well, or whether years of tolerable little decisions slowly turned a strong category into a merely average business.
For fee assumptions that change over time, use Amazon's own pricing documentation. Static margin advice ages badly.
FAQ
What is a good profit margin for Amazon FBA?
A good margin depends on which margin you mean. Across 8,383 successful valuations in our database, the average business posted 45.6% gross margin and 36.9% SDE margin. If you only know one of those, you only know part of the story.
Which Amazon FBA category has the highest profit margin?
In our single-category sample of larger categories, Beauty led at 51.9% average gross margin, followed by Health & Personal Care at 49.1%. That still doesn't make Beauty the automatic winner on valuation.
Does higher profit margin always mean a higher valuation?
No. Margin helps, but the premium compresses once the business already looks healthy. Lower-gross-margin categories like Pet Supplies can still match or beat Beauty on average SDE multiple.
Should I benchmark gross margin or SDE margin?
Start with gross margin because it is easier to measure. Use SDE margin if you want the number a buyer will actually underwrite.
Curious what your business is worth?
Get a free, instant valuation and see how your Amazon business stacks up.
Get Your Free Valuation