Contribution Margin for Amazon Products: What Good Actually Looks Like
The FBA Guys
March 18, 2026

Contribution Margin for Amazon Products: What Good Actually Looks Like
Revenue reassures sellers faster than it reassures buyers.
If you want a clean way to judge an Amazon SKU, contribution margin for Amazon products is the money left after the variable costs tied to each sale are stripped out: product cost, referral fees, FBA fulfillment, shipping, promos, and ad spend directly tied to that sale. It is the fastest way to see whether a product is actually carrying its own weight. And if you are trying to build a business that keeps its value, the contribution margin has to leave room for overhead and still turn into healthy SDE.
That is where the conversation usually gets sloppy.
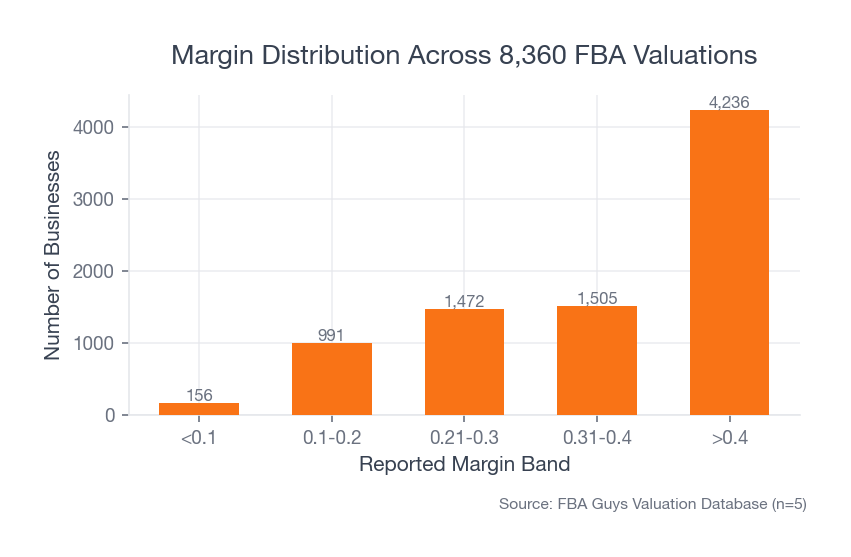
A seller sees a product doing seven figures in revenue and assumes the economics must be fine. Across 8,360 successful valuations in our data, businesses in the bottom margin band under 15% averaged $2.2 million in sales and only a 1.72x multiple. Businesses at 45%+ margin averaged about $1.17 million in sales and a 2.58x multiple. Bigger revenue can hide a weaker business for a surprisingly long time.
So what is a good contribution margin for Amazon products?
High enough that Amazon can take its share, your operating costs can still happen, and the business doesn't flinch every time freight, PPC, or returns get ugly for a month. In practice, the fragile zone starts in the teens. The healthier zone starts around the mid-30s. Above 45%, the economics usually give you room to breathe.
Not luxury. Room.
What a Good Contribution Margin for Amazon Products Actually Looks Like
Let's keep this simple for a minute.
Contribution margin is the gross dollar cushion each sale creates before fixed overhead and owner-level adjustments enter the picture. If a product sells for $100, and the variable costs tied to that sale total $62, the contribution margin is $38, or 38%.
That number tells you whether a sale helps. Company quality takes another layer of reading.
You still have software, payroll, bookkeeping, prep, insurance, and all the other less glamorous line items sellers love to ignore until they are trying to explain a bad P&L to someone else. This is why contribution margin and valuation always end up in the same room. A business doesn't get credit for a theoretically healthy SKU if the rest of the machine eats the economics alive.
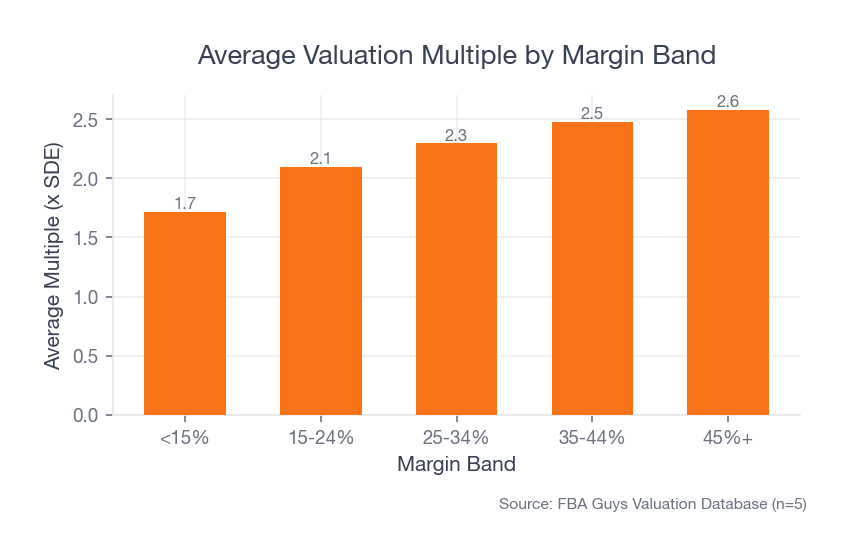
Our database makes the lower end of the range pretty uncomfortable. Businesses under 15% margin averaged a 1.72x multiple. Move into 15% to 24%, and the average multiple jumps to 2.10x. Reach 25% to 34%, and it moves again to 2.30x. You don't need a heroic leap to change the conversation. You need to get out of the danger zone first.
 Source: FBA Guys Valuation Database (n=8,360)
That matters because sellers often stop at the first reassuring answer. They ask whether the SKU is profitable. The more useful question is whether the unit economics leave enough headroom for the business to stay attractive after the usual operational mess shows up. Refund spikes happen. Container costs move. Amazon storage fees do what Amazon storage fees do. A contribution margin that only works on a neat spreadsheet will not survive long in the wild.
Contribution Margin for Amazon Products by Category
Category benchmarks help. They also get abused.
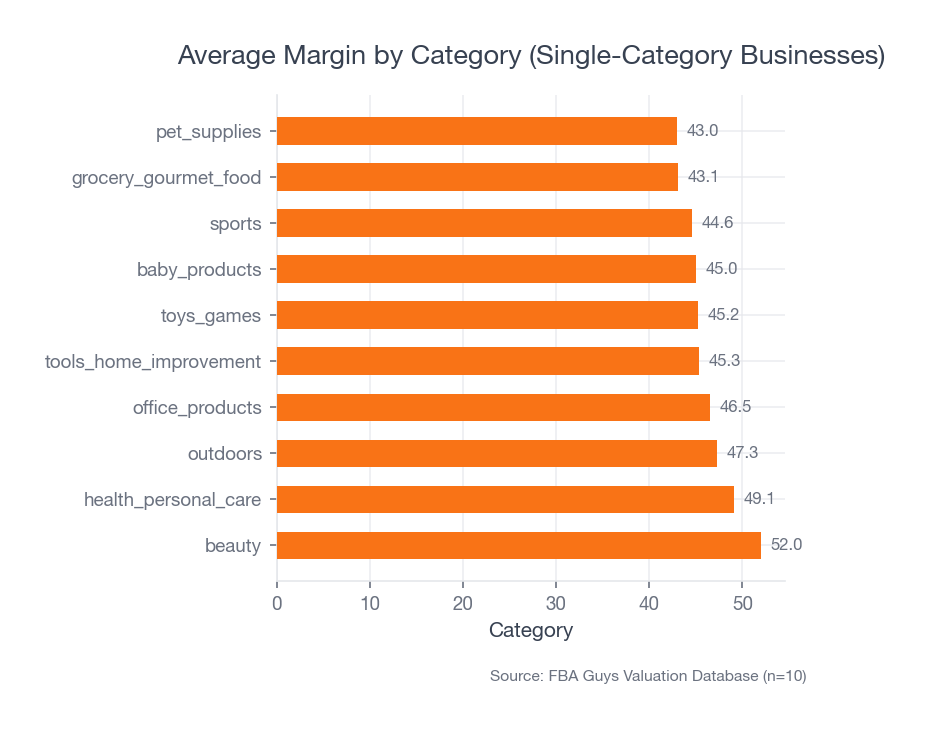
Among single-category businesses in our valuation database, Beauty averaged a 52.0% margin across 420 businesses. Health & Personal Care averaged 49.1% across 844. Home & Garden sat at 43.0%, but still across 1,606 businesses. Pet Supplies also averaged 43.0%, yet posted a 2.72x average multiple, slightly above Beauty's 2.59x.
People want category averages to do the thinking for them. They want to hear, "You sell in Beauty, so 50% is good," then move on. Real businesses don't behave that cleanly. Consumer Electronics averaged a 45.0% margin in our single-category slice and still produced only a 2.12x average multiple. Same neighborhood margin. Very different buyer reaction.
 Source: FBA Guys Valuation Database (single-category businesses, categories with n>=200)
Why? Because category margin is only one input. Buyers still care about obsolescence risk, price pressure, supplier concentration, account health, and whether there is any obvious path to growth left for the next owner. A pet business with stable repeat demand can look more durable than an electronics line that needs to outrun product fatigue every year.
Use category benchmarks as a starting point. They are useful for orientation. They are useless as a substitute for judgment.
Honestly, this is where a lot of sellers get lazy.
They benchmark against their category, see that they are roughly in range, and never ask whether the margin is coming from a repeatable advantage or from something temporary. A freight anomaly. An inventory stockout that reduced ad spend. A period where competition got weirdly quiet. A bookkeeper tossing half the mess into "Amazon Misc" because nobody wanted to spend Thursday afternoon untangling it. That line item always tells on people eventually.
Contribution Margin vs Gross Margin vs Net Margin vs SDE Margin
You need all four. You just shouldn't confuse them.
Contribution margin measures what is left after the sale-specific costs.
Gross margin usually stops at revenue minus cost of goods sold. Helpful, but flattering. If you need the cleaner starting point, How to Calculate Amazon Business's Gross Profit Margin is the right companion read.
Net margin includes operating expenses and gives you a better view of whether the business itself is functioning.
SDE margin goes one step further. It adjusts net income for owner compensation and valid add-backs so a buyer can see the earnings power of the business. That is the margin buyers end up caring about most when they price the company. If you want to run the number directly, use our SDE calculator.
This is why some Amazon businesses look healthier in screenshots than they do in diligence.
For an hour we thought we had a real integrity problem in one margin review. It was accrual timing. Inventory landed in the wrong period, the margin line sagged, and the P&L made a good business look worse than it was. That is fixable. Fuzzy accounting underneath a clean contribution-margin number is where the real trouble starts.
Chapter 10 of the Exitpreneur framework makes this point cleanly: buyers look at margin in dollars and as a percentage of revenue because squeezed margins change the risk profile of the whole business. Chapter 11 pushes it further. Miss the add-backs or use the wrong accounting treatment, and you can understate SDE by enough to drag the valuation down for no good reason.
So what should you track?
Track contribution margin at the SKU and channel level. Track gross margin to catch pricing and COGS pressure. Track net margin to see whether the operation is disciplined. Track SDE margin if you care what the business would look like to a buyer.
You should care.
Why Margin Matters More Than Revenue for Valuation
This is the section sellers usually resist.
Low-margin businesses in our database were often bigger. The under-15% group averaged $2.2 million in sales. The 45%+ group averaged just $1.17 million. Size is doing a lot of theater in that comparison.
Those higher-margin businesses averaged $586,363 in SDE and a $1.69 million valuation. The under-15% businesses averaged $193,022 in SDE and only $381,106 in valuation. Revenue can make the business look busy. Margin tells you whether the work creates anything worth buying. The broader valuation context is in The 27 FBA Business Metrics that Actually Matter.
There is another twist. Declining businesses can still show decent margin. In our data, businesses marked declined_a_lot averaged a 52.2% margin and only a 1.65x multiple. Businesses marked increased averaged a lower 44.5% margin and a 2.53x multiple. Buyers will tolerate less-than-perfect margin if they believe the business is moving in the right direction. They don't reward a fading business just because the current margin print looks respectable.
 Source: FBA Guys Valuation Database (records with SDE and valuation data)
That should bother you a little.
It means you can starve a business into looking efficient. Cut ads too hard, delay hires, lean on inventory too aggressively, and you might protect margin in the short term while damaging the trend line buyers actually pay for. Contribution margin is a control metric. Valuation comes from what that control buys you: earnings quality, confidence, and room for the next owner to grow.
How to Improve Contribution Margin Without Cutting Corners
Start with the variable costs you can actually control.
Renegotiate COGS. Fix packaging. Remove coupons you forgot were still running. Split branded defense campaigns from exploratory PPC so you can see what is subsidizing what. Use Amazon's FBA guidance and current pricing docs as a live reference rather than freezing last quarter's fee assumptions into your model, because those move and sellers get hurt when they act like they don't.
Then move to the more annoying work.
Clean up the accounting. Switch to accrual if growth and inventory timing are distorting the story. Get refund and reimbursement treatment consistent. Stop hiding unexplained swings in broad buckets. If contribution margin is healthy but net margin still looks thin, that gap is where the operational diagnosis lives.
And ask the operator's question. What kind of business is this margin sitting inside?
Forty percent contribution margin on a product with constant reorder demand, stable reviews, and rational ad costs means something very different from 40% on a fad product that needs fresh creative every three weeks to stay alive.
"Good" always needs a second sentence.
FAQ
What is a good contribution margin for Amazon products?
A good contribution margin is one that still leaves room for overhead and healthy SDE after Amazon takes fees and the business absorbs normal operating friction. In our valuation data, the teen margins look fragile. Mid-30s starts to look durable. Above 45% is where the business usually has real room to make mistakes without breaking.
Is contribution margin the same as profit margin?
Contribution margin sits earlier in the stack. It strips out variable costs tied to the sale. Profit margin includes more of the business overhead. SDE margin goes further and matters more for valuation.
Can a high-revenue Amazon product still have a bad contribution margin?
Constantly. Our lowest-margin businesses were often the largest by revenue. Revenue is noisy. Margin is where the truth starts.
Should I use category averages to price my product?
Use them to ask better questions. Category benchmarks can tell you whether you are obviously off. They will not tell you whether your margin is durable, transferable, or attractive to a buyer.
If you want the short version, contribution margin for Amazon products is about preserving enough economics at the SKU level that the full business still looks healthy once overhead, accounting reality, and buyer scrutiny show up.
Curious what your business is worth?
Get a free, instant valuation and see how your Amazon business stacks up.
Get Your Free Valuation