How to Calculate Amazon FBA Profit Margin Without Fooling Yourself
The FBA Guys
March 13, 2026

If you want the short answer, calculate Amazon FBA profit margin by taking revenue, subtracting your costs, dividing what is left by revenue, and turning that into a percentage.
That gives you a margin number. Not the whole truth.
Among 8,354 successful FBA valuations in our database, the average business posted a 45.6% gross margin. Average SDE margin was 36.9%. If you are trying to understand whether your FBA business is healthy, or what a buyer will care about later, calculate gross margin, net margin, and SDE margin separately.
How to Calculate Amazon FBA Profit Margin
You need three formulas, not one.
Gross margin formula
(Revenue - Cost of Goods Sold) / Revenue x 100
This measures product economics before the rest of the business gets involved. If you sell $500,000 and your landed COGS is $275,000, gross profit is $225,000 and gross margin is 45%.
Net profit margin formula
(Revenue - COGS - Operating Expenses) / Revenue x 100
This is the business-level number. It includes ad spend, payroll, software, prep, refunds, freight leakage, and all the little recurring costs sellers prefer to describe as temporary.
SDE margin formula
Seller's Discretionary Earnings / Revenue x 100
SDE means profit after operating costs, plus legitimate owner add-backs. For owner-operated FBA businesses, that is usually the earnings number buyers care about most.
So what should you track?
Gross margin for product quality. Net margin for operating health. SDE margin for valuation reality.
The fact is, many sellers say "profit margin" when they mean gross margin because gross margin is the easiest number to like.
What "Good" Actually Looks Like
There is no single good Amazon FBA profit margin.
There is a range.
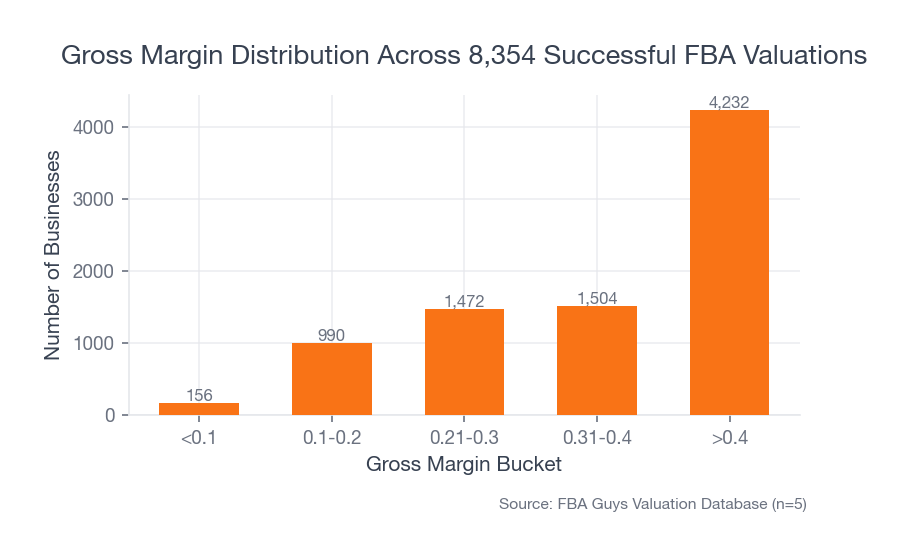
Across the 8,354 successful valuations in our dataset, 50.7% of businesses sat above 40% gross margin. Another 18.0% fell between 31% and 40%. Only 13.8% came in below 20%.
That sounds strong. It should also make you careful with generic advice.
If half the market already clears 40% gross margin, then 40% is not some rare badge of honor. It is a healthy threshold. It is not the whole diagnosis.
Average SDE multiples by gross margin bucket make the point:
- Under 10% gross margin:
1.57x - 10% to 20%:
1.94x - 21% to 30%:
2.30x - 31% to 40%:
2.40x - Above 40%:
2.57x
Margin improves value. Of course it does.
But the premium compresses once the business already looks healthy. Buyers still care about risk, documentation, and transferability. They are not buying a single percentage. That is one reason our guide to the 27 FBA business metrics that actually matter remains useful well after you know your margin.
 Source: FBA Guys Valuation Database (n=8,354)
Gross Margin vs Net Margin vs SDE Margin
This is where a lot of margin advice goes off the rails.
Gross margin tells you whether the product works.
Net margin tells you what is left after running the operation.
SDE margin tells you what the business really produces for one owner after real expenses are counted and legitimate add-backs are handled correctly.
That distinction is not academic. It changes how you read your own business.
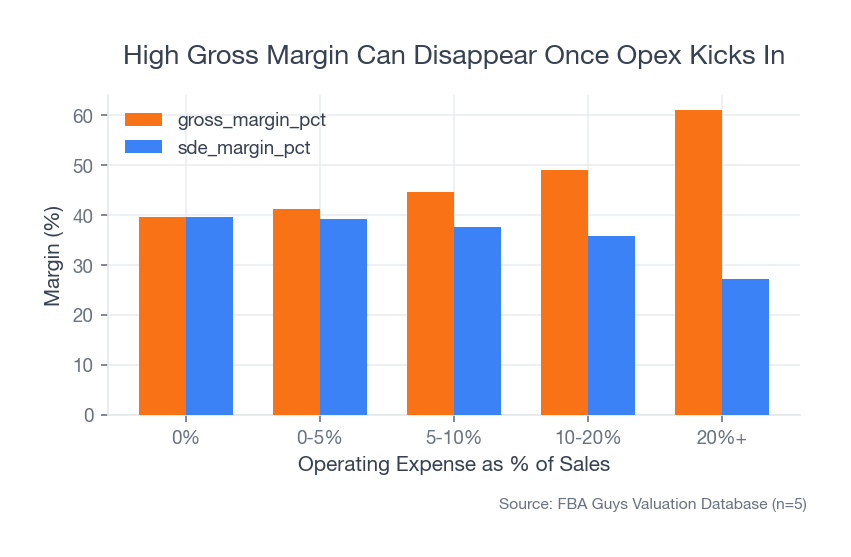
In our dataset, businesses with operating expense above 20% of sales averaged 61.1% gross margin. Great headline. Their average SDE margin was only 27.1%.
Businesses with operating expense between 0% and 5% averaged just 41.3% gross margin, but their average SDE margin was 39.3%.
Read that again.
The cleaner operator with lower gross margin often keeps more real earnings than the higher-margin seller whose cost structure sprawls all over the place.
We ran that query twice because it looked wrong the first time. It wasn't wrong. It was irritating.
 Source: FBA Guys Valuation Database (n=8,354)
If you are calculating your own margin stack, use this order:
- Revenue
- Minus landed COGS
- Minus recurring operating expense
- Plus documented owner add-backs
- Divide each stage by revenue
You should end up with gross margin, net margin, and SDE margin. If you only have the first number, you are still at the surface.
If you want help with that last step, our SDE calculator is a better next tool than another gross-margin-only spreadsheet.
Margins by Category: Where the Data Surprises You
Yes, category benchmarks are real.
No, they are not destiny.
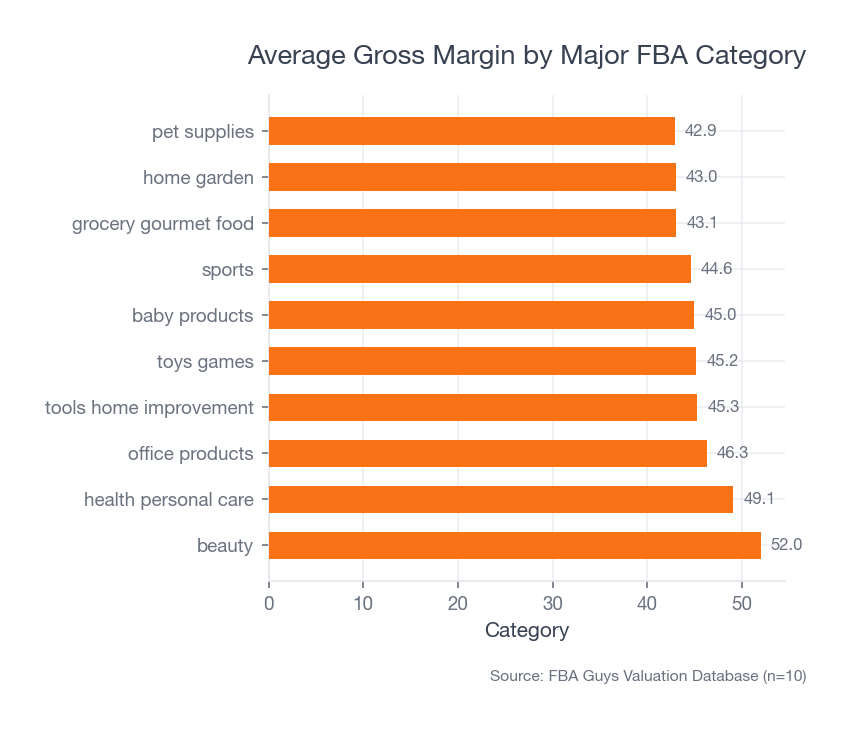
Among major single-category businesses in our dataset, Beauty averaged 52.0% gross margin and 41.2% SDE margin. Health & Personal Care averaged 49.1% and 39.8%. Home & Garden averaged 43.0% and 34.0%.
That is a real spread. It just isn't a different planet.
The more useful surprise is valuation. Beauty averaged a 2.59x SDE multiple. Health & Personal Care, despite slightly lower gross margin, averaged 2.71x. Pet Supplies averaged only 42.9% gross margin and still hit 2.71x.
That is why category-only advice gets sloppy fast.
Buyers still care about the rest of the business. Concentration. Documentation. Ease of transfer. Whether the numbers reconcile without turning diligence into a hostage situation.
One anonymized submission in the dataset reported $17,135 in annual sales, split between Books and Amazon Device Accessories, and still showed a 50% gross margin. Real row. Real number. Terrible benchmark for almost anyone. Category data helps, but judgment still matters.
 Source: FBA Guys Valuation Database (n=4,867)
If you only need the simple product-level version, our older piece on how to calculate Amazon gross margin is the right companion article.
Why Revenue Can Hide a Margin Problem
Bigger FBA businesses usually run lower margins.
That is not failure. It is scale.
Businesses under $100,000 in annual revenue averaged 50.8% gross margin and 42.8% SDE margin. Businesses over $1 million averaged 42.3% gross margin and 32.4% SDE margin.
The same slide shows up in the threshold data. 61.4% of sub-$100K businesses cleared 40% gross margin. Only 43.9% of $1M+ businesses did.
More SKUs. More ad spend. More staff. More places for one weak process to start leaking cash.
Revenue can make a business look impressive while margin discipline is getting worse in the background.
How to Improve Your Margins Without Cutting Corners
Start with the leak.
If gross margin is weak, attack product economics first. Supplier pricing, packaging efficiency, freight, prep, return rate, and price discipline all belong here.
If gross margin looks fine but SDE margin looks thin, move down the P&L. Audit PPC by SKU. Separate one-time costs from recurring ones. Cut software you barely use. Switch to accrual accounting if inventory timing still muddies the picture. Clean books still create an advantage because too many sellers keep tolerating ugly ones.
Use category benchmarks with restraint. Beauty and Health & Personal Care usually support stronger margin expectations. Home & Garden often gives you less room. Grocery can look fine at gross margin and still feel tight once operations get involved. The goal is not to mimic a category average. The goal is to understand whether your own cost structure makes sense.
Then calculate SDE the way a buyer would.
That is where the story gets honest.
For current fee assumptions, use Amazon's own pricing documentation and Fulfillment by Amazon guidance. Those details change. Static fee advice ages badly.
FAQ
What is a good profit margin for Amazon FBA?
A good margin depends on which margin you mean. In our data, the average business posted 45.6% gross margin and 36.9% SDE margin. If you only know one of those numbers, you only know half the situation.
Is 30% profit margin good for Amazon FBA?
Thirty percent gross margin can be healthy. Thirty percent SDE margin is stronger. Treating them as the same number is where people confuse themselves.
How do Amazon fees affect profit margin?
They reduce net and SDE margin through fulfillment, referral, storage, refund, and advertising costs. Fee structures change over time, so use Amazon's current documentation rather than assuming any old benchmark still holds.
Does higher margin always mean a higher valuation?
No. Higher margin helps, but the premium compresses once the business already looks healthy. In our data, the step from 31% to 40% gross margin up to 40%+ only moved average SDE multiple from 2.40x to 2.57x.
Curious what your business is worth?
Get a free, instant valuation and see how your Amazon business stacks up.
Get Your Free Valuation