Amazon Customer Returns Rate by Category: The Benchmark Is Only Useful After You Know What It Measures
The FBA Guys
May 31, 2026

Every Amazon seller wants a clean answer to the category return-rate question, because "normal" sounds like it should be something a competent operator can look up before the refund file starts looking suspicious.
What is normal for beauty? What is normal for electronics? What should a home-and-kitchen seller tolerate before the product is officially a problem? It feels like there should be a table somewhere that settles the argument, preferably one that doesn't require ten tabs, three Seller Central reports, and a private negotiation with your own anxiety.
The awkward answer is that an Amazon customer returns rate by category is only a starting point. Amazon does show sellers ASIN-level return-rate data inside seller tools, and Amazon uses product fee-category thresholds for the returns processing fee. But a category benchmark doesn't tell you whether your product has a normal return rate, a listing clarity problem, a packaging problem, a compatibility problem, or a margin problem wearing a nicer shirt.
That distinction matters because returns don't stay inside the returns report; they move into refund timing, inventory accuracy, review quality, advertising efficiency, and eventually the way a buyer reads the business. A 7% return rate can be harmless in one category and ugly in another, while a 14% return rate can be normal for the wrong product and fatal for the wrong margin structure.
So the useful question isn't only "what is the average return rate by category?" It is this: what kind of return rate can this SKU survive?
The honest benchmark problem
Broad ecommerce return benchmarks are not useless, but they do get used too lazily.
The National Retail Federation's 2025 Retail Returns Landscape estimated that 19.3% of online sales would be returned in 2025. That is the big-picture backdrop. Online commerce has a returns problem, and Amazon sellers live inside that world whether they sell socks, supplements, shower organizers, or small electronics.
But that number is not an Amazon category table. Amazon category return behavior depends on the product type, price point, buyer expectation, sizing uncertainty, compatibility risk, shipping damage, packaging, seasonality, and whether the customer can tell what they bought before it arrives. Apparel behaves differently from consumables, electronics behave differently from pantry items, and a replacement part behaves differently from a scented lotion. We shouldn't need to say this, but benchmark tables have a way of making smart people temporarily forget that products are physical objects.
The seller who asks, "Is 11% high?" is asking an incomplete question.
High compared with what? Category threshold? Peer ASINs? Gross margin? Contribution margin after returns? Review damage? Return processing fees? Unsellable inventory? The cash tied up in replacement stock while returned units drift through a fulfillment center while everyone pretends the month is finished?
One number won't carry that much weight.
What Amazon actually shows sellers
Amazon has been moving more return visibility into seller tools.
The Voice of the Customer dashboard includes Return Rate and Star Rating features. In its Seller Central announcement, Amazon describes Return Rate as the overall percentage of returns initiated in the past 12 months. That is useful because it pushes the seller away from a one-month panic and toward a longer ASIN-level view.
The FBA Returns Dashboard and Return Insights tools are more operational. Amazon has said the FBA Returns Dashboard helps sellers see top returned products, customer-reported return reasons, return trends, return alerts, and recommended actions. For return-processing-fee exposure, Amazon has also said Return Insights includes returned units, return-rate percentages used to calculate the fee, minimum thresholds, and units above the threshold.
That last part is where category starts to matter. Amazon's updated returns processing fee looks at returns across a three-month period beginning with the shipment month and ending two calendar months later, which means June shipments can create returns in June, July, and August before the fee shows up after the selling month already felt closed. Amazon has also said the fee applies only when returns exceed the threshold for the product's fee category, and products shipping fewer than 25 units in a month are not charged for that month. For the broader operating workflow, this Amazon FBA returns management guide goes deeper on the reports sellers should reconcile.
Not exactly a clean little monthly KPI, of course.
The practical implication is simple: use Amazon's own return-rate tools for the actual ASIN. Use category benchmarks to understand whether the ASIN deserves extra skepticism. Don't swap the two.
What our valuation data can and can't say
The FBA Guys valuation database does not track ASIN-level return rates, and that sentence needs to be early because otherwise the article starts lying by implication. We don't have a field for "customer returned this because it didn't fit." We don't have return reason, returned-unit condition, refund timing, return-processing-fee charges, or whether a return was customer choice, seller error, Amazon handling, or normal category friction.
What we do have, across 8,541 successful valuation submissions, are adjacent signals: category, review score, negative-review flags, SKU count, margin, sales, and valuation.
That is enough to say something useful, as long as we don't overstate it or pretend a proxy has magically become the thing itself.
Returns are one form of customer friction. Reviews are another. A weak review score doesn't prove a return problem, and a negative-review flag doesn't prove a return-rate issue. Still, both are places where the customer experience leaves a mark. If a category has more visible review weakness, it is usually a category where expectations are harder to set cleanly.
That was the pattern worth following.
The categories where friction shows up
Among categories with at least 40 submissions in our database, the highest share of review scores at or below 4.0 came from cell phones and accessories at 19.4%, health and personal care at 18.9%, consumer electronics at 18.5%, beauty at 14.9%, automotive and powersports at 14.2%, and camera/photo at 14.0%.
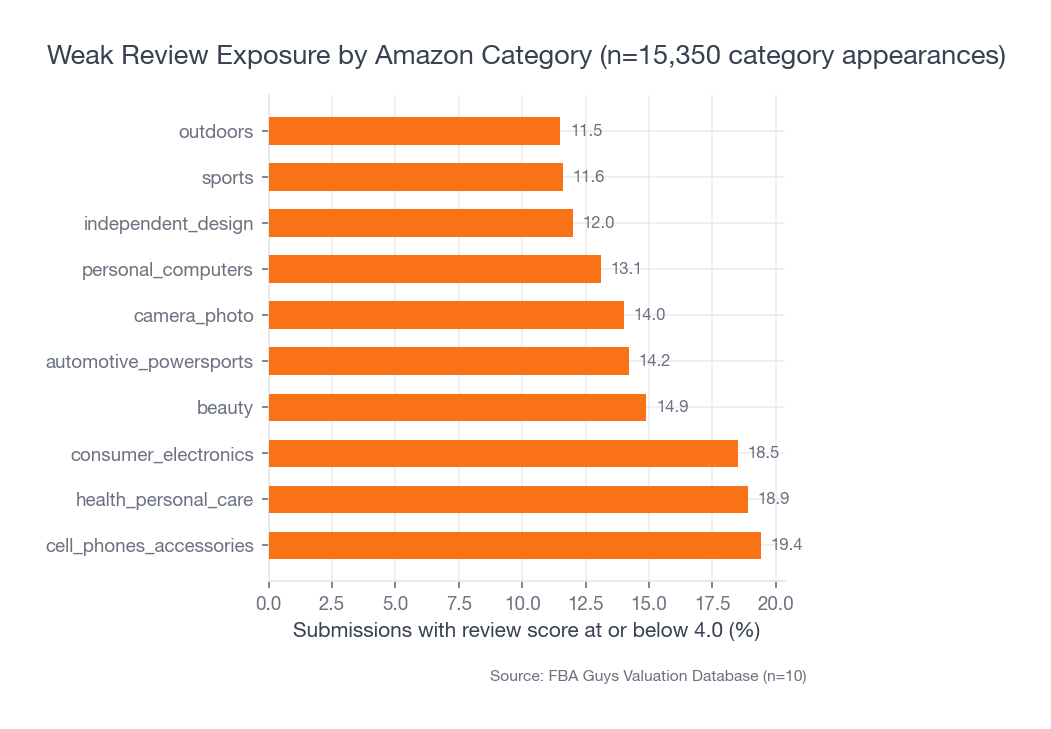 Source: FBA Guys Valuation Database (n=15,350 category appearances across 8,541 valuations)
That is not a return-rate table. It is a customer-friction table, and honestly it feels more useful than pretending category averages can explain every SKU.
Look at the categories. Cell phone accessories invite compatibility problems, health and personal care products collide with personal expectations, electronics have performance, setup, durability, and "I thought it did this other thing" risk, beauty products carry texture, scent, shade, packaging, and skin-feel problems, automotive parts have fitment issues, and camera products bring their own little catalog of compatibility and expectation problems.
The pattern isn't mysterious. The more a product depends on fit, compatibility, subjective preference, or post-purchase performance, the less useful a generic category benchmark becomes. A seller in those categories needs tighter ASIN-level monitoring because the return reason often lives in the detail: one variation, one supplier batch, one image that implies the wrong scale, one bullet that fails to say the adapter isn't included.
There is the messy detail.
A customer doesn't return "consumer electronics." They return the black USB-C hub because the product image made the cable look longer than it was, or because the compatibility note sat six scrolls below the buy box, or because the product worked with one laptop and not the other laptop sitting on the same desk.
Category is the neighborhood; the ASIN is the address, and the package is sitting on that porch whether the benchmark likes it or not.
SKU complexity hides the bad ASIN
The strongest signal in the data wasn't category. It was catalog size, which is annoying because everyone came here asking for a category answer.
When we grouped successful valuation submissions by SKU count, the negative-review signal rose steadily:
- 1-5 SKUs: 5.7%
- 6-20 SKUs: 7.4%
- 21-100 SKUs: 13.7%
- 101+ SKUs: 26.9%
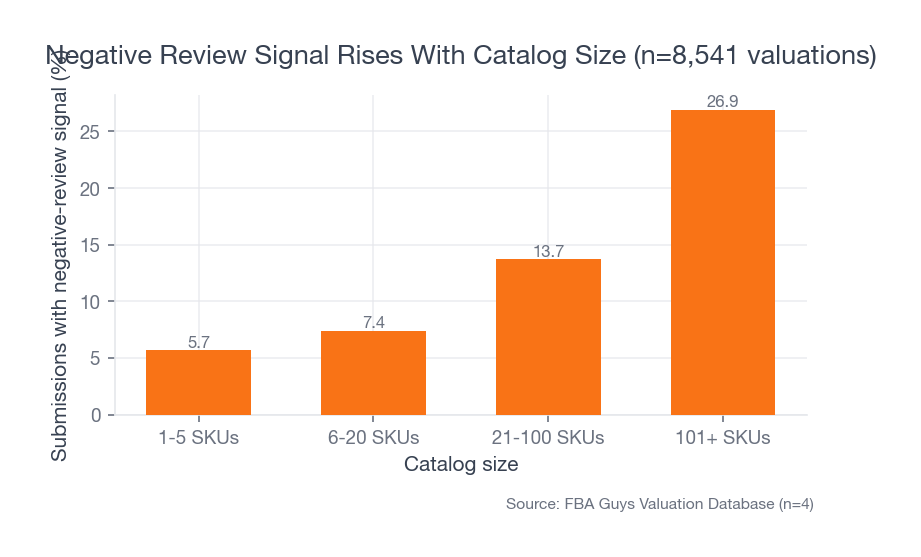 Source: FBA Guys Valuation Database (n=8,541 valuations)
Then the odd part showed up: average review score rose too, from 4.46 in the 1-5 SKU group to 4.61 in the 101+ SKU group. The first instinct is to distrust the result, but the better explanation is not that large catalogs make customers angrier and happier at the same time. It is that blended averages become less useful as the catalog expands, because a larger catalog can have plenty of strong products lifting the average while a smaller set of problem SKUs creates negative-review pockets, return spikes, support tickets, and inventory noise.
This is why a category return-rate benchmark can mislead a mature seller.
If you sell 180 SKUs across three related categories, your blended return rate may look normal. Your account-level average review score may look healthy. The problem may still be sitting in eight SKUs that share a supplier, a package insert, a size chart, or one misleading product image.
That is not a category problem anymore. It is an operating discipline problem, and it typically shows up later than it should.
Margin absorbs cost, not confusion
Sellers often talk about returns as if gross margin solves them, and to a point, yes. A high-margin product can survive more refunds than a thin-margin product, because a 55% gross-margin SKU has more room for mistakes than a 19% gross-margin SKU. This is why return rate belongs next to contribution margin, not in a lonely operations report.
But margin did not remove the customer-friction signal in our data.
Across most margin bands, the negative-review signal stayed fairly close: 13.4% in the 10-20% margin group, 11.7% in the 21-30% group, 11.2% in the 31-40% group, and 13.9% above 40%.
That is the part sellers should not skip. Margin can pay for a return, but it can't erase a review that tells future buyers the product ran small, arrived damaged, smelled strange, didn't fit the model number, or looked cheaper than the photo. Margin can hide the refund line for a while; it can't make a buyer in due diligence feel better if the return report looks unexplained and the review history is waving a little flag. This is the same reason gross margin and net margin need to be separated before a seller decides a product is healthy.
The category benchmark says what may be normal.
The margin model says whether normal is affordable.
How to use category benchmarks without fooling yourself
Start with the ASIN, then widen out.
First, pull the Amazon return-rate view for the product. Use the Voice of the Customer dashboard, FBA Returns Dashboard, Return Insights, and the FBA Customer Returns report. Don't stop at the account average, because the account average is where bad ASINs go to look innocent. Pull the ASIN, variation, return reason, disposition, and shipment-month view where available.
Second, compare the ASIN against its fee category and Amazon's current return-processing-fee threshold. This is the platform line. It tells you whether Amazon is likely to treat the return rate as abnormal enough to charge for excess returns.
Third, compare the ASIN against its product reality. A size-sensitive product needs a different standard than a sealed consumable, a compatibility-driven accessory needs a different standard than a simple home product, and a fragile item needs damage-rate tracking rather than just return-rate tracking.
Fourth, put the return rate into unit economics. Refunds, return processing fees, unsellable units, removals, disposal, replacement cost, ad waste, and recovery value all belong in the same view. A SKU with "normal" category returns can still be a bad SKU if every return destroys the economics.
Fifth, watch the public customer signal. Review score, review text, Voice of the Customer, product questions, and negative-review patterns tell you whether the return problem is private or visible. Visible is worse. If the issue is expectation-setting, start with main image clarity and A+ content before assuming the category is simply cursed.
The seller's job is not to memorize a category chart. The job is to keep the category chart from becoming an excuse.
The benchmark that matters before a sale
Buyers don't need returns to be zero; they need returns to be understood. A product with a known seasonal return pattern, clean reason codes, stable recovery process, and documented fix history is a different business from a product with the same return rate and no explanation.
This is where documentation starts to matter more than the benchmark. Can the seller show three months of return-rate data by ASIN? Can they explain why returns rose after a batch change? Can they separate customer preference from product defect? Can they show whether returned units came back sellable, unsellable, reimbursed, removed, or disposed?
A seller who can answer those questions has a business. A seller who only says "our category runs high" has a shrug in spreadsheet form.
And buyers do not pay premiums for shrugs.
FAQ
What is a normal Amazon customer returns rate by category?
There is no single public Amazon customer returns rate by category that settles the question for every seller. Use Amazon's ASIN-level return-rate tools and current fee-category thresholds first, then compare the result with broader ecommerce category behavior.
Where can Amazon sellers see return-rate data?
Amazon sellers can use tools such as Voice of the Customer, the FBA Returns Dashboard, Return Insights, and the FBA Customer Returns report. The useful view is ASIN-level, not just account-level.
Is a high return rate always bad?
No. Some categories naturally carry more returns because of fit, compatibility, preference, or post-purchase testing. The issue is whether the return rate is normal for the product, affordable in the margin model, and documented well enough that a buyer can understand it.
Does FBA Guys have return-rate benchmarks by category?
Not directly. The valuation database does not store ASIN-level return rates or return reasons. It can show adjacent customer-friction patterns by category, SKU count, margin, and review signals, but those should not be treated as return-rate data.
Curious what your business is worth?
Get a free, instant valuation and see how your Amazon business stacks up.
Get Your Free Valuation