Amazon FBA Returns Management: The Refund Is Only the First Number
The FBA Guys
May 22, 2026
Returns feel small when you look at them one order at a time.
One refund. One opened box. One customer who decided the color looked different in the kitchen than it did on the phone. None of that feels like a business model problem while the sales graph is still moving up and to the right.
Amazon FBA returns management is the operating system for tracking why customers send products back, what each return costs, whether inventory comes back sellable, and whether the same problem is showing up across a SKU, bundle, image, size chart, or supplier batch.
The refund is the visible part.
The quieter part is what returns start doing to margin, reviews, inventory accuracy, account health, and buyer confidence if no one is watching the pattern.
As of 2026, Amazon still handles customer service and returns for FBA orders. That is the convenience FBA sells. Amazon describes FBA as a program where Amazon picks, packs, ships, handles customer service, and handles returns. Useful. Also slightly dangerous, because anything Amazon handles for you can start to feel like something Amazon is managing for you.
Those are not the same.
What Amazon FBA Returns Management Actually Includes
For an FBA order, Amazon is usually the front-line returns operator. The customer initiates the return, Amazon processes the return according to its policies, and the unit may come back to fulfillment-center inventory, become unsellable, get reimbursed if Amazon is responsible for the loss or damage, or drift into the kind of report that only gets opened when a month already looks strange.
That last part is where the work lives.
A seller still has to know:
- Which ASINs are being returned.
- Why customers are returning them.
- Whether the returned units are sellable, unsellable, disposed, removed, reimbursed, or still pending.
- Whether return rates are high enough to trigger extra fees.
- Whether the problem is product quality, packaging, listing clarity, sizing, buyer expectation, fraud, or normal category behavior.
- Whether the same return reason is starting to affect reviews.
The operational habit is simple. Pull the return data before it becomes a story.
Amazon's seller-fulfilled returns guide is not an FBA manual, but it explains the customer-side logic that still matters to FBA sellers. Amazon says most items can be returned within 30 days of estimated delivery, and it describes refund at first scan, returnless refunds, chargebacks, A-to-z claims, customer service refunds, and restocking fees for seller-fulfilled orders. FBA changes who touches the package. It doesn't change the customer's expectations.
One awkward detail: the customer usually experiences the return as Amazon's process. The margin impact lands in your business.
Why Returns Are a Margin Problem First
A return usually costs more than the refund.
There is the original sale reversal. There may be a retained referral-fee component, return processing cost, unsellable inventory, removal or disposal cost, repackaging cost, customer service drag, lost ad efficiency, and the occasional review that makes the next sale harder.
This is why "our return rate is only 7%" isn't enough by itself.
Seven percent on a light, durable, high-margin consumable is one thing. Seven percent on a bulky product with expensive packaging and a high damage rate is a completely different animal. The number has to sit inside unit economics.
If you already track contribution margin by SKU, add returns to that view. If you don't, this is where the spreadsheet starts earning its keep. The useful version isn't complicated:
- Gross sales
- Refunds
- Return-related Amazon fees
- Units returned to sellable inventory
- Units returned unsellable
- Reimbursements
- Removal, disposal, liquidation, or grade-and-resell recovery
- Net margin after returns
This is also where we would link you to our piece on Amazon FBA unit economics, because returns are unit economics after the sale has already happened.
Amazon's current return processing fee structure makes the timing more interesting. In an Amazon Seller Central announcement about the updated returns processing fee, Amazon said the fee looks at product returns across a three-month period starting with the shipment month and ending two calendar months later. It also said the fee applies only if returns exceed the threshold for the product's fee category, and products shipping fewer than 25 units in a month are not charged for that month. Amazon's announcement is here.
That means returns can show up after the sales month has already been mentally filed away.
We dislike that. Not because Amazon is hiding it, but because it tempts operators to look at the wrong period. June sales can create September charges. A SKU can look healthy in the month it shipped and less healthy once the return window finishes breathing.
What Our Valuation Data Can and Can't Say
The FBA Guys database does not track ASIN-level return rate.
That matters. We shouldn't pretend a negative review flag is a return report. It isn't. We don't have a field that says "this product came back because the zipper broke," or "this bundle got returned because the photo implied two units and the box contained one."
What we do have are customer-friction signals that sit near the returns problem: negative-review flags, review scores, repeat-order bands, SKU count, account-health indicators, margin, revenue, and derived value-to-SDE.
Across 8,521 successful valuation records, the negative-review signal was the one that kept pulling us back.
Businesses without a negative-review signal averaged 2.47 derived value-to-SDE across 7,420 records. Businesses with a negative-review signal averaged 1.99 across 1,099 records.
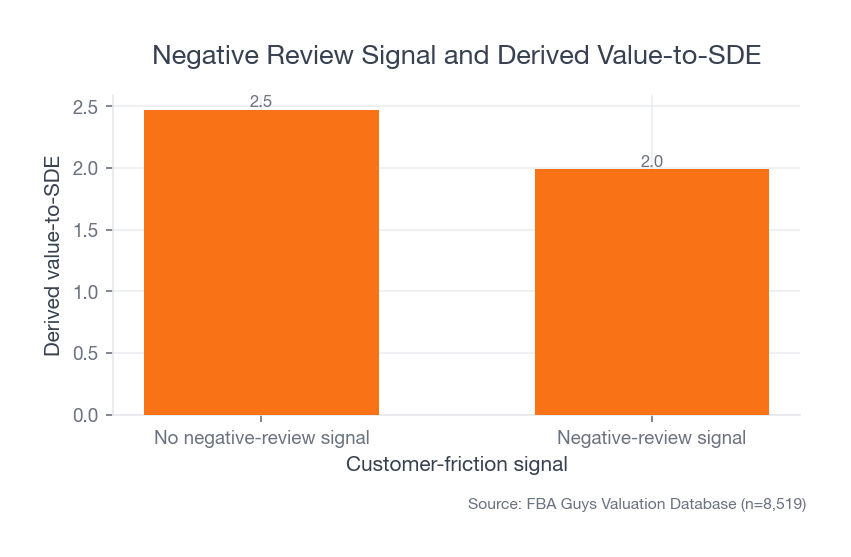 Source: FBA Guys Valuation Database (n=8,519)
That doesn't mean a return caused the valuation gap, of course.
It means visible customer friction tends to travel with lower valuation quality. Sometimes the friction is product quality. Sometimes it is listing clarity. Sometimes it is packaging. Sometimes it is a category where customers buy three sizes and keep one. The database can't sort all of that for us.
But it can still tell us where the smoke is.
The more useful finding came when we crossed that signal with margin. Negative-review businesses had lower derived value-to-SDE inside every margin bucket we tested. Under 20% margin, the no-negative-review group averaged 1.92 while the negative-review group averaged 1.48. At 50%+ margin, the gap was still there: 2.66 versus 2.20.
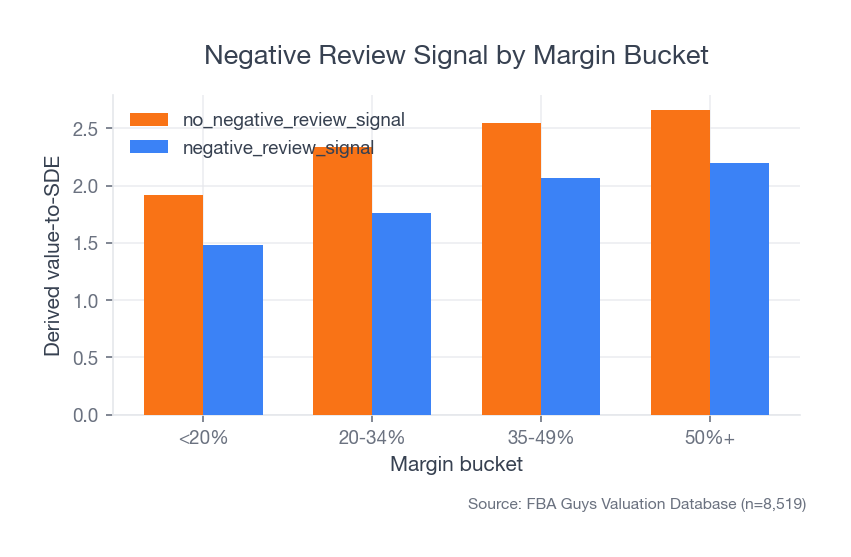 Source: FBA Guys Valuation Database (n=8,519)
That is the part worth sitting with.
High margin gives you room to absorb returns. It doesn't make customer friction disappear. A business can have lovely gross margin and still look fragile if the customer experience keeps leaving marks on the listing.
The Review Score Floor
Review score was less neat than we expected.
Businesses with review scores below 3.8 averaged 1.81 derived value-to-SDE across 104 records. Businesses between 3.8 and 4.2 averaged 2.35. The 4.3-4.7 bucket averaged 2.46. The 4.8-5.0 bucket averaged 2.32.
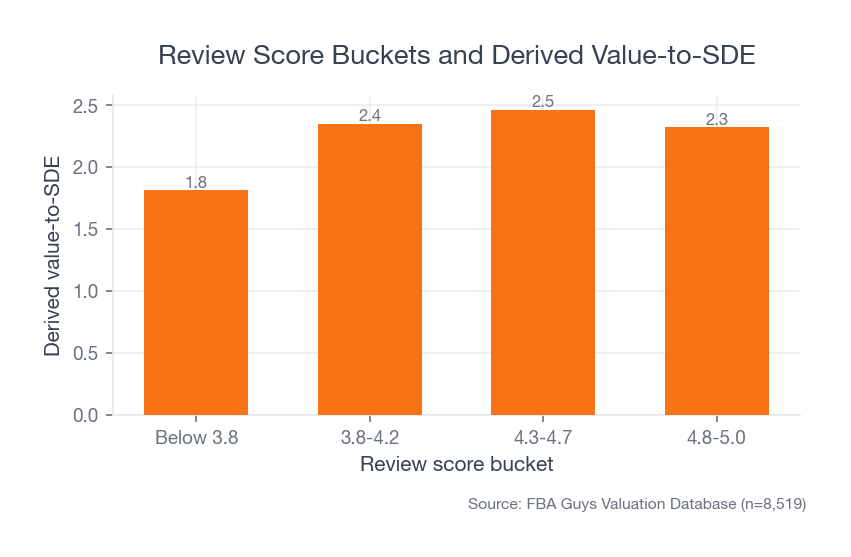 Source: FBA Guys Valuation Database (n=8,519)
The 5.0 bucket being lower than the 4.3-4.7 bucket looks odd at first glance.
Then it starts to make sense. A perfect-looking score can come from fewer reviews, a younger listing, a narrower SKU, or a product that simply hasn't been tested by enough customers yet. The bigger business signal may be avoiding weak-review territory rather than chasing cosmetic perfection.
For returns management, that is useful.
The goal isn't to make every customer delighted enough to write poetry about a garlic press. The goal is to keep preventable confusion, defects, sizing errors, missing components, and packaging damage from pushing the product into the part of the marketplace where customers start warning each other.
There is a difference.
The Reports Sellers Should Watch
Start with the FBA Customer Returns report.
This is the basic table that tells you which orders came back, why the customer said they returned the item, disposition, status, and other return details. Pull it by ASIN. Don't only scan totals.
Then look at the FBA Returns page and Return Insights dashboard if available in your account. Amazon has said the dashboard includes returned units, return-rate percentages used to calculate the return processing fee, minimum thresholds, and units above the threshold.
After that, reconcile returns against:
- Payments reports, so refunds and reimbursements are not floating outside the P&L.
- Inventory adjustments, so returned units don't quietly distort available inventory.
- Removal or disposal orders, so unsellable returns are not treated as normal shrinkage.
- Product reviews and Voice of the Customer, so return reasons are compared with what customers say publicly.
- SKU-level contribution margin, so the return-heavy product doesn't hide inside blended profitability.
This is dull work.
Good. Dull is underrated. Dull means someone can show a buyer a return-rate trend, explain what changed, and point to the three months when a packaging issue got fixed. Dull means the bookkeeper doesn't have to guess why refunds spiked after Prime Day. Dull means you know whether the problem is one ASIN or the whole catalog.
The bad version is discovering the pattern during due diligence.
How to Reduce Preventable Returns
Most returns are not preventable. Some absolutely are.
The practical work usually starts in five places.
1. Product Detail Page Clarity
Returns often begin before the customer clicks Buy Now.
Photos imply scale. Titles imply compatibility. Bullets imply use cases. Variation names imply color. A+ content implies what comes in the box. If the page lets the customer imagine the wrong product, the return was partially created by the listing.
This is especially common with bundles, replacement parts, sizing, and anything where the product looks larger in isolation than it feels in a hand.
One small test helps: read only the main image, title, first bullet, and variation name. What could a reasonable customer misunderstand?
Fix that first.
2. Packaging and Transit Reality
Packaging decisions often look fine until they meet a conveyor belt.
Fragile corners, leaking caps, bent retail boxes, scuffed surfaces, and products that rattle inside oversized cartons can all become return reasons. Some of this is Amazon handling. Some of it is packaging design. Some of it is a seller hoping the supplier's carton is good enough because changing it creates another email thread.
There was probably some pride involved in that last one.
If return reasons mention damage, the answer isn't only a reimbursement workflow. It is a packaging test, supplier conversation, and cost model. A slightly more expensive insert may be cheaper than a return, a replacement, and a negative review.
3. Batch-Level Quality Control
Returns that cluster by date are different from returns that are steady.
A steady baseline may be normal category behavior. A sudden spike after a restock often points to a supplier batch, material substitution, labeling issue, or packaging change. The return report should be reviewed by received batch or shipment date where possible.
This is where documentation turns into money.
If you can tie a return spike to one production run, you can quarantine inventory, file supplier claims, update inspection criteria, and explain the event later. If you can't, the business just looks noisy.
4. Size, Fit, Compatibility, and Expectation
Some categories need more friction before purchase.
That sounds wrong until you see the return file. Apparel, accessories, replacement parts, and compatibility-driven products often benefit from more precise buying guidance. The goal is not to slow down every buyer. It is to slow down the wrong buyer before they create a return.
Give customers enough information to disqualify themselves.
That line feels bad to a growth marketer and wonderful to an operator.
5. Return Reason Coding
Amazon's customer return reason is useful, but it is not gospel.
Customers choose the reason that gets the return done. Sometimes "defective" means defective. Sometimes it means confusing. Sometimes it means the buyer changed their mind and picked a reason that felt close enough.
Read the reason. Then read the reviews. Then inspect the unit if it comes back. Then look at customer questions. The point is not to argue with the dropdown. The point is to find the pattern behind it.
When Returnless Refunds Make Sense
Returnless refunds can be smart, especially when the cost of reverse logistics is higher than the value of the item.
As of the Amazon announcement we reviewed, FBA Returnless Resolutions by price lets US sellers set a price threshold from $1 to $75 for eligible products. Amazon says the program can save fees related to high return rates, customer returns processing, storage, and removals. It also lists exclusions such as hazmat, recalled products, gift cards, heavy and bulky items, and items with an average sales price above $75.
This should be a math decision, not a mood.
For each candidate SKU, compare:
- Product cost
- Referral fee and FBA fee impact
- Expected return shipping or processing cost
- Probability the unit comes back sellable
- Removal, disposal, liquidation, or grade-and-resell recovery
- Fraud risk
- Customer goodwill
- Review risk
The right threshold may be lower than the maximum Amazon allows. A $42 item that often comes back sellable may deserve the return. A $14 item that comes back opened, sticky, and unsellable may not.
Very glamorous business, this.
How Returns Show Up in Valuation and Due Diligence
Returns affect valuation in two ways.
First, they affect earnings. Refunds, fees, unsellable inventory, and operational time reduce the money a buyer is actually buying. Seller's Discretionary Earnings, or SDE, is the owner-operated earnings number buyers commonly use to value small businesses. If returns are not properly reflected in the trailing twelve months, the buyer is going to find that.
Second, returns affect confidence.
Buyer confidence comes from being able to understand the business. A return problem with documentation is an operating issue. A return problem without documentation is a trust issue.
That is a very different conversation.
This is why the Playbook's old-fashioned documentation advice still applies to a modern Seller Central problem. Keep a simple monthly return memo for the important SKUs:
- Return rate by ASIN.
- Top three return reasons.
- Unsellable units.
- Return-related fees.
- Reimbursements requested and received.
- Corrective action taken.
- Result the following month.
No buyer expects a zero-return business. Buyers do expect the seller to know whether returns are normal, seasonal, category-driven, product-specific, or getting worse.
Our SKU-count data adds one more caution. Businesses with 6-20 SKUs averaged 2.69 derived value-to-SDE. Businesses with 100+ SKUs averaged 1.98.
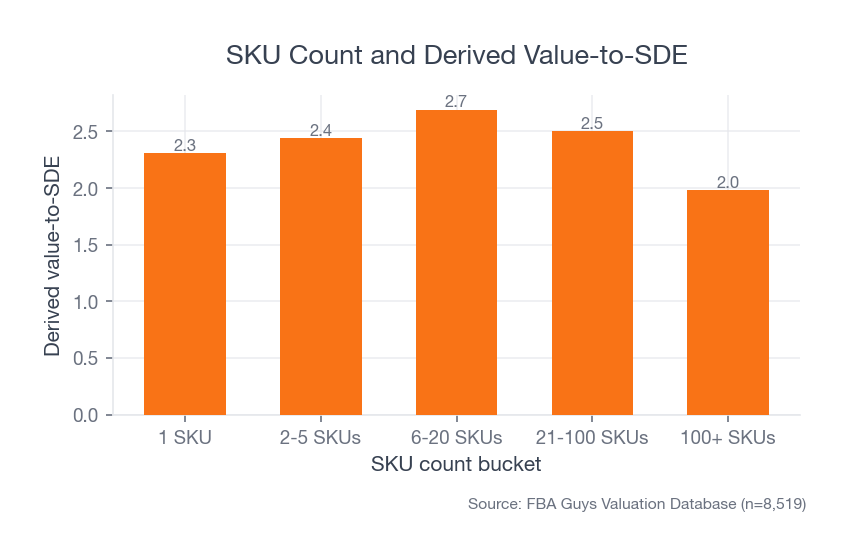 Source: FBA Guys Valuation Database (n=8,519)
That doesn't mean large catalogs are bad. It means complexity needs systems.
A 120-SKU catalog with clean return reporting, documented inspection routines, and clear action logs can be a real asset. A 120-SKU catalog where returns are reviewed only when the P&L looks odd is a scavenger hunt.
Buyers don't pay premium multiples for scavenger hunts.
A Simple Monthly Returns Routine
If you want the practical version, build one monthly returns review and keep it boring.
Pull the FBA Customer Returns report. Sort by ASIN. Compare returned units to shipped units. Flag anything above its normal range. Read the top return reasons. Compare those reasons to recent reviews, customer questions, Voice of the Customer, and support messages.
Then choose one action per problem SKU.
Maybe the main image needs scale context in secondary images. Maybe the title needs compatibility language. Maybe the supplier needs to tighten a tolerance. Maybe the insert card needs clearer assembly instructions. Maybe the SKU needs returnless resolution because the economics of getting it back are ridiculous. Maybe the product should simply be killed.
Not every SKU deserves saving.
Record what you changed and check the next two months. That timing matters because Amazon's return processing fee logic can follow the shipment month into the next two calendar months. The sale month alone won't tell the full story.
The goal is not to become obsessed with returns.
The goal is to stop treating returns as a customer-service afterthought when they are really a product, margin, inventory, review, and valuation signal all at once.
FAQ
What is Amazon FBA returns management?
Amazon FBA returns management is the process of tracking, analyzing, and acting on customer returns for FBA products. Amazon handles much of the customer-facing return process, but the seller still needs to monitor return reasons, returned inventory condition, refunds, fees, reimbursements, unsellable units, and SKU-level margin impact.
Does Amazon handle FBA returns for sellers?
Yes. For FBA orders, Amazon generally handles customer service and returns. That doesn't remove the seller's financial responsibility for refunds, return-related fees, unsellable inventory, return-rate monitoring, or reimbursement follow-up.
How do FBA returns affect profit?
FBA returns affect profit through refunded sales, return processing fees where applicable, unsellable inventory, removal or disposal costs, repackaging costs, lost ad efficiency, and possible review damage. The cleanest view is SKU-level contribution margin after returns.
What reports should FBA sellers review for returns?
Start with the FBA Customer Returns report, then compare it with payments, reimbursements, inventory adjustments, removal or disposal orders, Voice of the Customer, product reviews, and SKU-level contribution margin. The useful pattern usually appears when those reports are read together.
Do returns affect the value of an Amazon FBA business?
Returns can affect value when they reduce SDE, create weak reviews, signal product quality issues, or make inventory and margin harder to explain. Buyers don't need a zero-return business. They need a business where returns are measured, understood, and managed.
Curious what your business is worth?
Get a free, instant valuation and see how your Amazon business stacks up.
Get Your Free Valuation