Amazon FBA Unit Economics Explained: The Unit Has to Survive the Whole Business
The FBA Guys
April 29, 2026

The cleanest Amazon FBA unit economics spreadsheet we have seen still had one ugly row in it.
It was labeled "misc."
Every seller knows the unit matters. You buy a product for one amount, sell it for another, pay Amazon, pay freight, pay ads, and hope there is enough left over to make the business worth the trouble. Amazon FBA unit economics explained properly comes down to a simple question: after every cost required to sell, replace, and support one unit, does that unit still create enough profit to support the whole business?
The phrase sounds more complicated than it is. Unit economics means the profit math of one sellable unit. For Amazon FBA, that unit has to carry landed product cost, Amazon referral fees, FBA fulfillment, storage, inbound shipping or placement cost, returns, promotions, advertising, software, and eventually the owner earnings a buyer would underwrite.
That last part is where the spreadsheet gets less comfortable.
Amazon FBA Unit Economics Explained
The basic formula looks like this:
Selling price - landed product cost - Amazon referral fee - FBA fulfillment cost - storage allocation - inbound freight or placement cost - returns and refunds - promotions - advertising cost per unit = contribution profit per unit.
Contribution profit is the amount left after the costs that move with the sale. It is closely related to contribution margin for Amazon products, which is contribution profit shown as a percentage of revenue.
Then the business has to pay everything that doesn't fit neatly inside one order: software, bookkeeping, contractors, photography, samples, professional fees, warehouse help, and the owner's time if the owner is doing real work inside the company.
That is why a unit-economics sheet should have three layers:
- Product margin: selling price minus landed COGS.
- Contribution margin: product margin minus selling and fulfillment costs tied to each order.
- SDE margin: owner earnings after operating expenses, adjusted for legitimate owner benefits.
SDE means Seller's Discretionary Earnings. It is the earnings base most owner-operated Amazon businesses are valued on, usually using trailing twelve months.
The formula is not hard. The discipline is keeping every cost attached to the unit long enough for the truth to show up.
What Belongs in the Unit
Start with the costs you can see.
Landed COGS includes the product cost, freight-in, duties, tariffs, inspection, prep, packaging, and any other cost needed to get that unit ready to sell. If you want the longer treatment, we covered the moving parts in the Amazon FBA landed cost breakdown.
Then come Amazon's selling and fulfillment costs. As of the writing of this article, Amazon says referral fees vary by category and are charged as a percentage of the total price or a minimum amount, whichever is greater. Amazon also lists the Professional selling plan at $39.99 per month and the Individual plan at $0.99 per item sold on its pricing page.
FBA adds another layer. Amazon's FBA page says fulfillment costs depend on product size tier and shipping weight, while storage costs are charged monthly based on average daily cubic-foot volume. The same page lists standard-size storage at $0.78 per cubic foot from January through September and $2.40 from October through December, with different rates for oversize products. Those numbers can change, so the live FBA page and Seller Central fee reports should win over any saved spreadsheet.
Now add the costs that get missed because they don't arrive with a tidy label:
- Inbound placement or inbound shipping allocation
- Returns processing and refund leakage
- Coupon discounts and deal fees
- PPC spend per unit sold
- Reimbursement shortfalls
- Disposal, removal, or liquidation costs
- Storage fees spread across the units that actually sell
This is where the "misc" row starts doing too much work.
Gross Margin Is the First Test, Not the Last One
Gross margin is revenue minus COGS, divided by revenue. It answers a useful question: after the product itself is paid for, how much room is left?
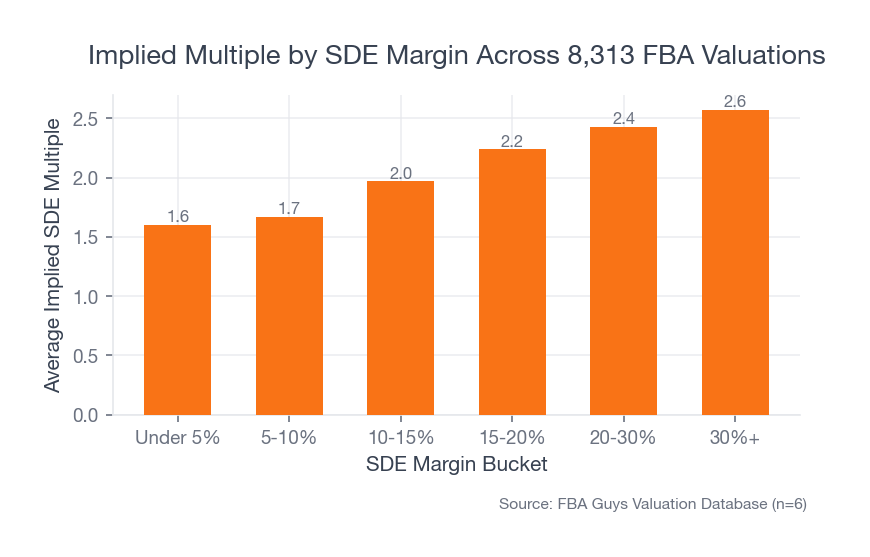
Our database confirms the obvious part. Among 8,313 usable successful valuations, businesses with gross margins under 10% averaged a 1.61x implied SDE multiple. Businesses above 40% gross margin averaged 2.58x.
Fine. A better product margin usually helps.
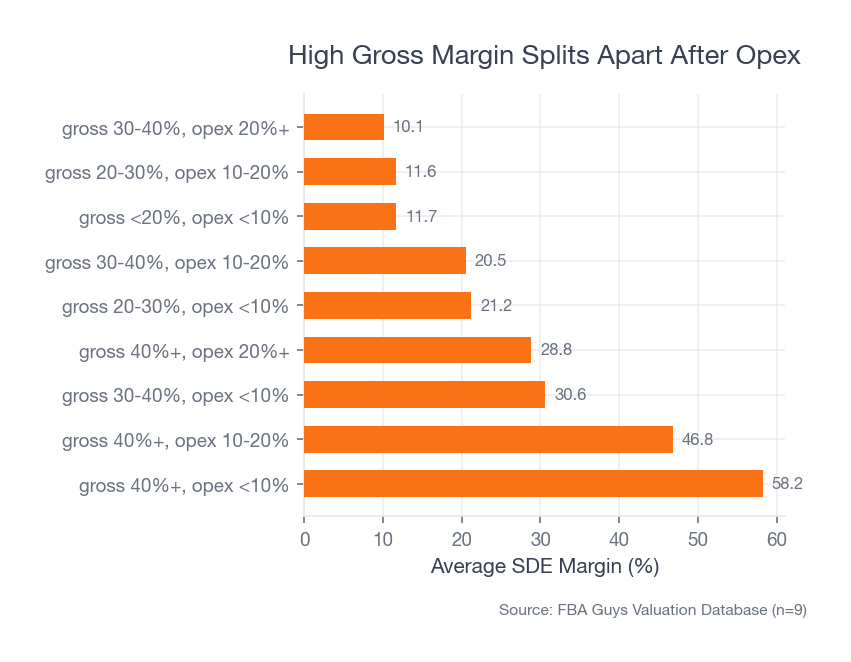
The more interesting part showed up after we stopped looking at gross margin by itself. Businesses with gross margin above 40% and operating expenses under 10% of sales averaged a 58.2% SDE margin. Businesses with gross margin above 40% and operating expenses above 20% averaged only a 28.8% SDE margin.
 Source: FBA Guys Valuation Database (n=8,313 usable valuations)
Same broad gross-margin neighborhood. Completely different business.
This is the part of unit economics that starts to feel less like a SKU worksheet and more like an operating review. The product can be profitable and still require too much advertising, too much handling, too much support, or too much owner attention to produce the earnings you thought it would produce.
There is a little scar in this analysis. We expected the gross-margin buckets to carry more of the story because gross margin is the first number everyone reaches for. It did matter. Then the opex split made the result look smaller than we wanted it to be. The better read was less flattering to the tidy spreadsheet and more useful to the operator.
Contribution Margin Is Where the Unit Starts Telling the Truth
Contribution margin asks a sharper question: after the costs tied to selling one more unit, what remains?
For Amazon FBA, that usually means landed COGS, referral fee, FBA fulfillment, per-unit storage allocation, inbound cost, return allowance, discounts, and ad spend. If PPC is driving the sale, PPC belongs in the unit. If a coupon is the reason the conversion rate works, the coupon belongs in the unit.
Here is a simplified version:
| Line item | Per-unit amount |
|---|---|
| Selling price | $39.99 |
| Landed COGS | -$10.40 |
| Referral fee | -$6.00 |
| FBA fulfillment | -$4.55 |
| Inbound freight / placement | -$0.85 |
| Storage allocation | -$0.30 |
| Expected returns leakage | -$0.70 |
| PPC per unit sold | -$5.25 |
| Contribution profit | $11.94 |
| Contribution margin | 29.9% |
The exact numbers don't matter. Your numbers do.
A 30% contribution margin can be healthy in one business and thin in another. It depends on repeat orders, catalog depth, fixed operating expense, working capital, and how much of the margin depends on Amazon Ads behaving nicely. We have seen enough PPC-driven P&Ls to know that "profitable after ads" deserves a second look when organic rank weakens or TACoS drifts.
Of course, a unit doesn't need to be perfect. It needs to be repeatable.
SDE Margin Is Where Unit Economics Become Business Value
SDE margin is Seller's Discretionary Earnings divided by revenue. It is the percentage of sales that makes it through to owner earnings after the business has paid for the work required to operate.
This is where the FBA Guys database gets useful.
Across 8,313 usable successful valuations, businesses under 5% SDE margin averaged 20.4% gross margin, 3.1% SDE margin, a 1.60x implied SDE multiple, and 0.05x value-to-sales. Businesses at 30%+ SDE margin averaged 58.7% gross margin, 51.7% SDE margin, a 2.57x implied SDE multiple, and 1.34x value-to-sales.
 Source: FBA Guys Valuation Database (n=8,313 usable valuations)
That is not a small spread. It is the difference between units that technically sell for more than they cost and units that support a business someone can value with confidence.
There is a reason the valuation conversation eventually comes back to SDE. Gross margin tells you whether the product has room. Contribution margin tells you whether the order has room. SDE margin tells you whether the company has room.
This also explains why gross margin and net margin shouldn't be treated as interchangeable. A seller can have a respectable gross margin and still run a business where nearly every extra dollar disappears into ads, headcount, storage, refunds, and tools. The unit survives the product test and fails the company test.
Inventory Turns Can Break an Otherwise Good Unit
Inventory is the strange part of FBA unit economics because it can stay off the P&L at the exact moment it is consuming cash.
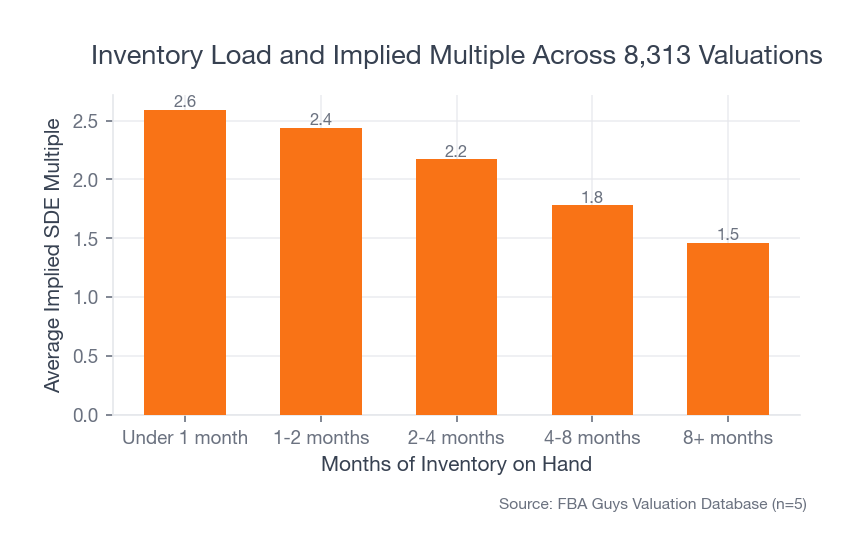
Our data kept poking at this. Businesses with under one month of inventory on hand averaged 43.8% gross margin, 36.1% SDE margin, and a 2.59x implied SDE multiple. Businesses with 8+ months of inventory on hand averaged higher gross margin at 52.5% and higher SDE margin at 41.8%, yet their implied SDE multiple averaged only 1.46x.
 Source: FBA Guys Valuation Database (n=8,313 usable valuations)
What do you do with that?
The first answer is restraint. The database doesn't tell us which units were stale, seasonal, stranded, oversized, or simply bought ahead of a supplier delay. It only tells us that heavy inventory load shows up differently in valuation math.
The operator answer is more practical. A unit that earns $12 on paper but requires you to keep nine months of inventory on the shelf isn't behaving like a $12 unit. It is dragging cash, storage exposure, forecasting risk, and buyer working-capital needs behind it. The unit might still be good. The business might still be good. The buyer has to fund the pile.
This is why a unit-economics sheet should include inventory turns. If you sell 1,000 units per month and keep 2,000 units in stock, that is a different economic engine than selling 1,000 units per month while holding 9,000 units because the MOQ got out of hand.
There was probably a supplier email involved. There usually is.
Scale Can Make the Percentages Look Worse
Here is the section that doesn't fit the clean version of the article.
In the database, businesses under $100K in revenue averaged 49.3% gross margin and 41.4% SDE margin. Businesses over $1M averaged lower gross margin at 41.8% and lower SDE margin at 32.0%. The smaller businesses looked prettier on margin.
The $1M+ businesses still averaged the higher implied SDE multiple: 2.61x versus 2.01x.
That result is easy to misuse. It doesn't mean lower margin is better. It certainly doesn't mean scale fixes bad unit economics. It means a buyer is usually looking at more than a margin percentage: earnings dollars, operational maturity, transferability, supplier depth, sales history, documentation, and the odds that the business can keep going after the owner leaves.
A tiny business can have beautiful percentages because the owner is doing half the work for free, the catalog has not met real complexity yet, and the monthly P&L still fits on one screen. A larger FBA business may carry lower margins because it has staff, software, freight systems, launch costs, and process.
Sometimes that is healthy. Sometimes it is bloat.
The unit-economics question changes as the company grows. Early on, you are asking whether the unit works. Later, you are asking whether the unit still works after the business becomes real.
How to Build a Unit Economics Sheet for Amazon FBA
Build the sheet at the SKU level first. Then roll it up by product line and by account.
Use one row per SKU and keep these columns visible:
- Selling price
- Landed COGS per unit
- Referral fee
- FBA fulfillment fee
- Inbound shipping or placement allocation
- Monthly storage allocation
- Return and refund allowance
- Promotion or coupon cost
- PPC cost per unit sold
- Contribution profit
- Contribution margin
- Units sold per month
- Inventory on hand
- Months of inventory on hand
- Gross profit dollars
- Contribution profit dollars
Amazon's Revenue Calculator and Fee Preview workflows can help estimate current fees, costs, and upcoming fee changes. Use them. Then reconcile the estimates against actual settlement reports and monthly storage fee reports because estimates are estimates, and fee previews don't know every messy thing that happens after the sale.
At the account level, add the monthly operating expenses:
- Software
- Bookkeeping
- Contractors
- Owner payroll or replacement labor
- Samples and product development
- Photography and creative
- Professional fees
- Warehouse or prep center costs
- Non-Amazon fulfillment costs, if applicable
Then compare gross margin, contribution margin, and SDE margin in the same view.
This is where a monthly habit matters more than a beautiful template. If your unit economics only get updated when a fee changes or when a product suddenly feels less profitable, the sheet becomes a postmortem. Update it when landed cost changes, when FBA fees change, when PPC cost per unit moves, when return rates shift, and when storage exposure starts creeping up.
The Monthly Review Should Feel Slightly Uncomfortable
Once the sheet exists, the real work is asking the same questions every month without letting the answer get softened by memory.
Which SKUs still work if PPC cost per unit rises by 15%? Which ones still work if the supplier adds 40 cents to the unit cost and ocean freight doesn't come back down by the time the next purchase order is due? Which products look profitable only because storage has not been allocated back to the units that sat for three months before selling?
Those are not dramatic questions. They are the ordinary ones, which is why they get skipped.
You want the review to separate three types of products. First, there are units that clearly work: contribution margin is healthy, inventory turns are sane, PPC isn't doing all the lifting, and the product still leaves room for operating expense after the order ships. Second, there are units that work only under current conditions: they need a certain ad cost, a certain freight rate, a certain conversion rate, or a certain reorder quantity. Third, there are units that make the account look bigger while quietly thinning the earnings base.
The third group is where sellers tend to argue with the sheet.
Maybe the product has great reviews. Maybe it anchors a variation family. Maybe it brings in customers who buy something else later. Maybe discontinuing it would irritate the supplier because it shares an MOQ with a stronger SKU. All of that may be true, and some of it may justify keeping the product. The point of the review is not to force every unit into a neat pass-or-fail box. The point is to know what each unit is asking the business to tolerate.
What happens if you keep a weak unit because it supports a stronger one? Fine, but say that in the notes. What happens if you keep a slow mover because the supplier MOQ makes the stronger product cheaper? Fine again, but don't let the weak SKU pretend it is earning its place on pure margin. What happens if a product is only profitable because you don't assign creative, samples, or returns back to it? The sheet should make that visible before the P&L makes it expensive.
This is also where the unit-economics review becomes useful for valuation. A buyer doesn't need every product to be gorgeous. A buyer does need to understand which products are carrying the earnings, which products are supporting the catalog, and which products are consuming cash because no one wants to make the uncomfortable call yet.
If you can explain that clearly, the business becomes easier to evaluate.
The Accounting Has to Match the Unit
A unit-economics sheet can be right and the books can still be wrong.
That sounds annoying because it is annoying.
If the sheet uses landed cost per unit but the P&L records inventory purchases on cash basis, the two systems are speaking different languages. If freight is spread across units in the sheet but dumped into one month in the books, gross margin by month gets noisy. If reimbursements, returns, and storage fees sit in vague expense categories, the unit economics might look precise while the financial statements stay blurry.
This is why we keep coming back to COGS tracking. The cost has to follow the unit. We covered the mechanics in how to track COGS for Amazon FBA, but the principle is simple enough: the unit economics sheet and the P&L should explain each other.
The database gives a proxy for this, not proof. Businesses with both tax returns and separated finances averaged a 6.1 confidence score and 2.74x implied SDE multiple. Businesses with neither signal averaged a 5.5 confidence score and 1.93x. That doesn't prove the documentation caused the multiple. It does show that cleaner evidence tends to sit beside more confident valuation math.
The fact is, unit economics that can't be reconciled are just a persuasive spreadsheet.
FAQ
What are Amazon FBA unit economics?
Amazon FBA unit economics are the profit mechanics of one sellable unit after landed product cost, Amazon referral fees, FBA fulfillment, storage, inbound shipping, returns, promotions, advertising, and related costs are assigned to that unit. The goal is to see whether each sale contributes enough profit to support the business.
What is a good unit economics margin for Amazon FBA?
A good margin depends on the product, category, ad dependence, inventory turns, and operating expense load. In our valuation database, the stronger line appeared at the SDE margin level: businesses with 30%+ SDE margin averaged a 2.57x implied SDE multiple, while those under 5% averaged 1.60x.
Should PPC be included in unit economics?
Yes, when PPC is required to make the sale. If a unit only sells at the expected volume because ads are running, the ad cost belongs in contribution margin. You can still separate organic and paid sales for analysis, but blended profitability needs the ad cost included.
How often should Amazon sellers update unit economics?
Update the sheet whenever a major input changes: landed COGS, referral fee category, FBA fulfillment fee, storage exposure, PPC cost per unit, return rate, coupon strategy, or supplier MOQ. For active products, a monthly review is usually the minimum useful rhythm.
Do unit economics affect business valuation?
Yes. Unit economics flow into gross margin, contribution margin, SDE margin, working-capital needs, and buyer confidence. A buyer won't value a SKU worksheet by itself, but the worksheet helps explain whether the company's earnings are durable.
Conclusion
The unit has to survive more than the purchase order.
It has to survive Amazon's fee structure, the ad account, the return rate, the storage clock, the reorder cycle, the monthly close, and the owner's actual workload. When the unit still works after all of that, the business starts to get interesting.
Amazon FBA unit economics explained in one sentence is simple enough: every unit needs to leave behind enough contribution profit to support real SDE after the business does the work required to sell it again.
The spreadsheet can be clean. Let it be clean.
Just don't let the clean version hide the business.
Curious what your business is worth?
Get a free, instant valuation and see how your Amazon business stacks up.
Get Your Free Valuation