How to Track COGS for Amazon FBA: Make the Cost Follow the Unit, Not the Invoice
The FBA Guys
April 8, 2026

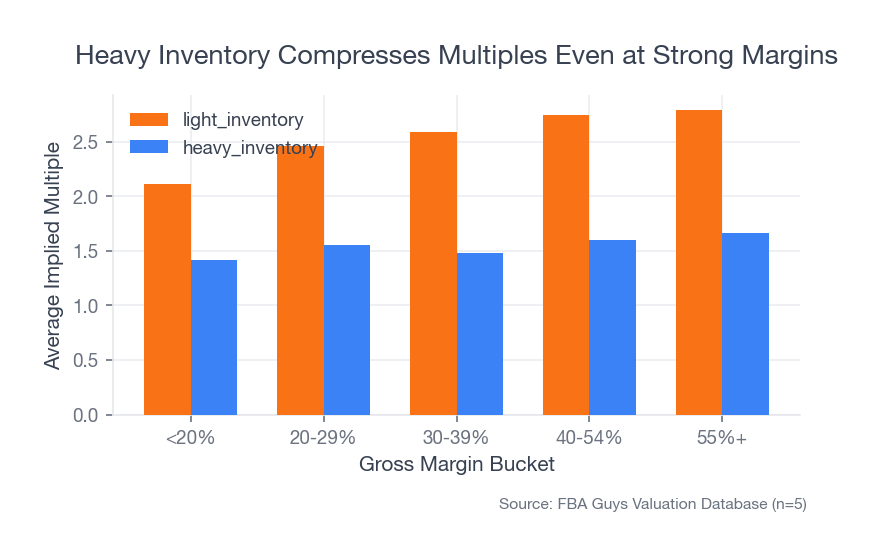
Among businesses in our valuation database with gross margins above 55 percent, 256 showed up carrying inventory-to-SDE ratios above 300 percent, and the average multiple on that subgroup ran at 1.66x while comparable-margin businesses with light inventory loads averaged 2.79x. That gap is worth sitting with, because it shows up inside what most operators would call a healthy cohort — strong unit economics, real margin, and still a compressed multiple.
COGS timing is often what's driving the distance between those two groups. The product cost and the freight bill are accurate numbers. The question is which period absorbs them, and that question tends to get settled by default rather than design.
What COGS Tracking Is Measuring
COGS tracking is asking one narrow question: what did it cost to put the units that sold this month into saleable condition?
The answer includes supplier cost, inbound freight, duties where relevant, and unit-level prep or packaging — everything required to land the product in inventory ready to sell. The recognition timing follows the units. A container arrives in March and the units sell across April, May, and June, so the cost of that inventory belongs in the months the business produced revenue from it, allocated in proportion to what moved each period.
Recognition month and payment month are different events, and keeping them separate is the whole mechanism.
If you want the definitional boundary between COGS and overhead, Amazon FBA cost of goods sold explained covers that in detail.
The Six-Step Monthly Close
The mechanics are straightforward and don't require sophisticated software.
- Start with beginning inventory at landed cost.
- Add each inventory receipt that actually landed during the month, including the direct inbound costs tied to getting it into saleable inventory.
- Separate received inventory from inventory that was merely ordered, prepaid, or somewhere over the Pacific.
- Identify units sold during the month by SKU, batch, or whatever consistent method your books can support.
- Assign landed cost to those sold units using one method. Keep using it.
- Reconcile ending inventory so the balance sheet, the inventory record, and physical reality are all describing the same business.
Step five is where the question gets specific: does the assigned cost actually follow the unit, or is it following the invoice date?
When freight is front-loaded before a big selling event, or several months of inventory land in a single payment, the monthly picture depends entirely on how the recognition is handled. To illustrate: a seller receives two large purchase orders in the last week of the month, pays the freight bill immediately, then sells only a fraction of those units before month-end, so on cash accounting the full freight charge lands in the current period while the following month carries none of it, even though most of the units sell then and the two periods look like a much larger swing than the business actually produced.
Where Timing Distortion Compounds
Freight is the most consequential source of timing distortion, and the numbers show why.
The Playbook uses a specific example: $24,000 in freight paid for the next four months of inventory, recognized all in the current period. Allocate that cost across the months it belongs to, and SDE rises by roughly $18,000, which at a 3.5x multiple represents around $63,000 of business value sitting inside one invoice's recognition date.
Inventory receipt is the second timing layer, particularly when shipments arrive near month-end or when a single purchase order spans multiple delivery dates, since the question of which month absorbs the batch cost tends to get resolved by whatever is most convenient at close time rather than by where the units actually went.
Classification is the third. From the kinds of books we see regularly: one line labeled Amazon Misc, another Freight TBD, a note at month-end promising cleanup. In one version of this spreadsheet, Amazon Misc varied from $417 to $1,184 across three months with no explanation anyone in the business could provide, which means every downstream metric inherited that ambiguity without anyone choosing to let it.
For the operational detail on freight allocation specifically, Amazon FBA landed cost breakdown is the natural companion.
The Close Process, Not the Tool
Careful operators working from a spreadsheet and closing monthly tend to produce better operating pictures than businesses running polished dashboards on loose recognition timing, because the discipline of reconciling each period is what makes the numbers describe the business rather than just describe when cash moved. Software becomes useful once that discipline is in place and stable.
The P&L gets cleaner when the close forces three things to agree: the books, the inventory records, and the physical stock. When those three versions match, the monthly gross margin is reporting on what actually happened in that period. When they drift, the monthly picture starts to describe timing rather than performance.
Freight Timing, Inventory Turns, and What the Data Shows
The database doesn't have a field called bad_cogs_tracking, but it does show where heavy inventory tends to build.
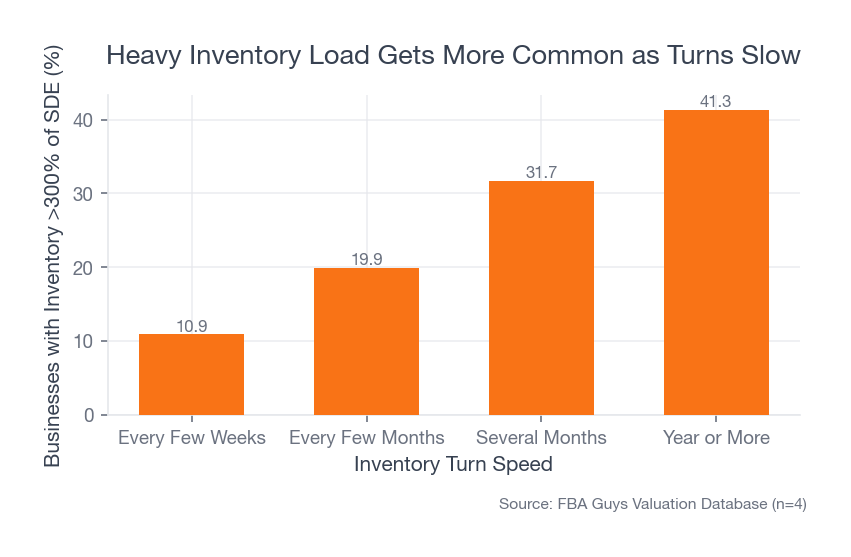
Among businesses turning inventory every few weeks, 10.9 percent carried inventory above 300 percent of SDE. At every-few-months turns, that share rises to 19.9 percent. At several months, 31.7 percent. At year or more, 41.3 percent of businesses are in that heavy-inventory bucket.
 Source: FBA Guys Valuation Database (n=10,164 grouped valuations)
Slow turns give timing distortions more room to accumulate, since more inventory sits on the shelf, more freight lands in periods that don't align with the actual sell-through, and more of the gross margin line ends up tracking payment timing rather than production. That's the operating picture behind those 256 high-margin, heavy-inventory businesses in the opening: the product genuinely earns the margin, and the inventory position alongside it is what buyers end up pricing separately.
 Source: FBA Guys Valuation Database (n=8,407 successful valuations across plotted buckets)
The monthly reporting structure that connects this to the P&L is in the Amazon seller profit and loss statement guide.
Why Buyers Care Before You're Selling
Documentation quality tracks with the multiple in the data, and it's worth understanding why.
In our successful valuation data, businesses with tax returns and business-only books averaged a 2.75x multiple across 3,755 cases, while businesses without tax returns and with mixed books averaged 1.97x across 115 cases. Documentation quality proxies for many things at once, and this particular proxy still carries a meaningful gap.
The moment sellers tend to feel it is in planning conversations, well before anything formal happens. The business feels solid: cash is available, revenue is moving, margin looks reasonable. Then someone asks for a monthly roll-forward, or wants ending inventory reconciled to the balance sheet, or asks why freight cost spiked in a month where sell-through was flat, and the answers get imprecise in a way that requires context and caveats to make them usable. That conversation is substantially easier to have in a slow month than in a due diligence process.
If you want the broader accounting system around this, Amazon FBA accounting basics is the natural next read.
Starting the Monthly Close
The process comes down to three habits.
Define COGS narrowly: product cost plus the direct landed cost of getting those units into saleable inventory.
Track recognition month separately from payment month. The freight payment happens when the invoice arrives; the COGS recognition belongs in the period when the funded units sell, and keeping those two dates from collapsing into one is what makes the close meaningful.
Close monthly and reconcile ending inventory across your books, your inventory records, and what's physically in stock, and keep going until the three versions agree.
Everything after that is refinement.
FAQ
What should be included in Amazon FBA COGS?
Product cost plus the direct landed costs required to get that unit into saleable inventory: freight, duties where relevant, and unit-level prep or packaging. PPC, software subscriptions, and payroll sit outside this boundary.
Can I track Amazon FBA COGS on cash-basis books?
Cash-basis books record when money moved, which is a different picture from when inventory moved out. For businesses with meaningful inventory levels or long lead times between payment and sell-through, the two approaches describe materially different months.
Does it matter whether I use FIFO or weighted average cost?
Consistency matters more than the specific method. The recognition timing of freight, prep, and duty tends to create more distortion in FBA books than the choice between FIFO and weighted average, so that's the more consequential thing to get right.
How often should I close the books for COGS purposes?
Monthly. Timing distortions compound quietly across periods, and catching them at month-end is far less work than unwinding six months of drift before a lender or valuation conversation.
Why does COGS tracking affect valuation?
Because buyers price the quality of the earnings picture alongside the level, and monthly numbers that reliably match costs to the periods they belong to give buyers more to work with when they're trying to understand what the business actually produced.
Curious what your business is worth?
Get a free, instant valuation and see how your Amazon business stacks up.
Get Your Free Valuation