Amazon FBA Gross Margin vs Net Margin: The Gap Is Where the Business Starts Talking
The FBA Guys
April 17, 2026

Gross margin is the first number most Amazon sellers look at because it feels close to the product. Net margin is the number that starts showing whether the business can actually carry its own weight.
For Amazon FBA, gross margin measures what remains after product costs. Net margin measures what remains after the operating expenses needed to run the business. In our valuation work, we usually care even more about SDE margin because owner-operated businesses are valued from seller's discretionary earnings, not from a clean accounting label.
That distinction sounds tidy.
It isn't tidy in the books.
In our database of 8,427 successful FBA valuations with usable margin data, the average business showed a 45.7% gross margin and a 36.9% derived SDE margin. That 8.8-point spread is where a lot of business quality hides. Sometimes it is normal overhead. Sometimes it is advertising dependency, sloppy COGS timing, VA sprawl, software subscriptions, freight that got parked in the wrong month, or a line item called "Amazon misc" that nobody wants to explain because it has been sitting there since 2021.
The fact is, a strong gross margin is worth knowing. It just doesn't finish the read.
What Gross Margin Measures
Gross margin starts with product economics. For an Amazon FBA seller, it usually means revenue minus cost of goods sold, expressed as a percentage of revenue.
If you sell $100 of product and the landed product cost attached to those units is $55, gross margin is 45%. For the basic formula, see our guide on how to calculate Amazon gross margin.
Simple enough.
The useful part of gross margin is that it keeps your attention close to the unit. Pricing, landed cost, freight, packaging, supplier increases, tariffs, and product mix all show up here before they show up anywhere else. If gross margin starts sliding, the business is usually telling you that the product economics have changed.
This is why gross margin still matters in a valuation conversation. Buyers want to know whether a product has room to absorb normal damage: fee increases, coupon tests, return spikes, freight weirdness, and the small insults that come with selling physical products on a marketplace you don't control.
Our data reflects that. Businesses under 20% gross margin averaged an 11.5% SDE margin and a 1.86x derived SDE multiple. At 30% to 39% gross margin, average SDE margin reached 27.2% and the average multiple rose to 2.37x. At 50%+ gross margin, average SDE margin reached 55.3%.
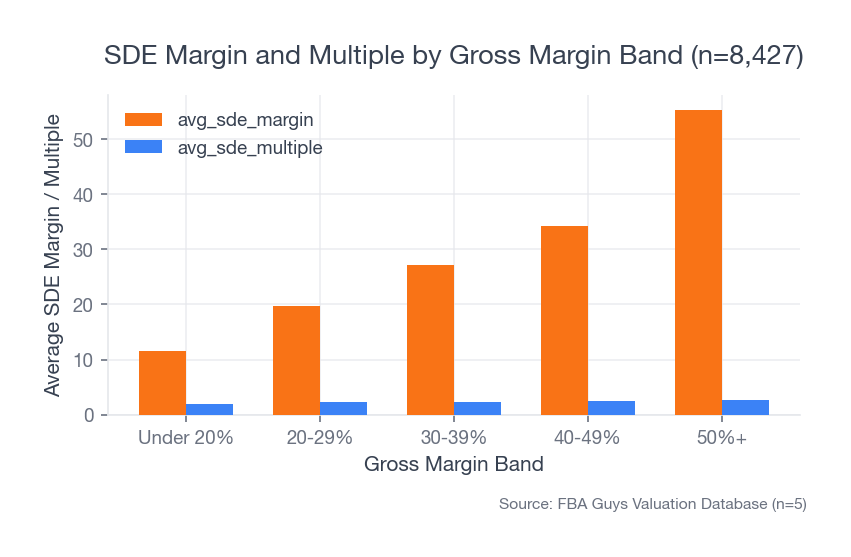 Source: FBA Guys Valuation Database (n=8,427)
That is a real pattern. Gross margin is not decoration.
What Net Margin Measures
Net margin moves down the P&L. It asks what remains after the business pays for the operating structure around the product.
For an Amazon business, that can include advertising, software, contractors, 3PL fees, storage, samples, bookkeeping, reimbursements work, design, photography, and the odd $79/month tool someone added during a launch and forgot to cancel. We've all seen that drawer.
This is where the gross-margin number starts losing its innocence.
A business can have a lovely gross margin and still run heavy. The product may be profitable, while the system required to sell it keeps eating the result. That is not automatically bad. A larger, more mature business usually needs more operating structure. The question is whether the expense creates durable revenue or just keeps the machine from coughing.
In our dataset, businesses with operating expense equal to 0% to 4% of sales averaged a 40.9% gross margin and a 39.5% SDE margin. Very little leaked out between the product number and the owner-earnings number.
Businesses with operating expense at 20%+ of sales averaged a much prettier 61.3% gross margin. Their average SDE margin was only 27.2%.
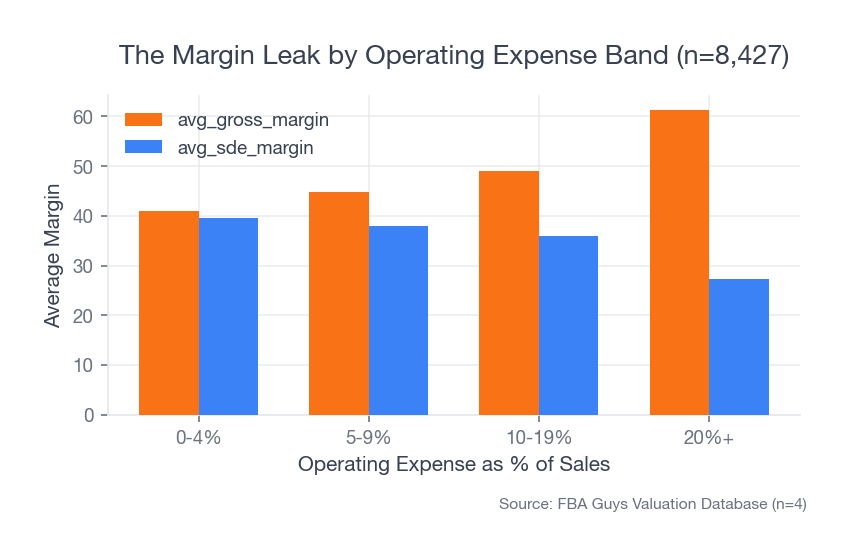 Source: FBA Guys Valuation Database (n=8,427)
That result is irritating in a useful way. The higher gross-margin group can look more impressive at first glance, but the business has to spend more to produce the sale. Maybe that spend is smart. Maybe it is the toll required by the category. Maybe it is a quiet sign that the brand has less organic pull than the product margin suggests.
You don't know until you look below gross margin.
Why SDE Margin Belongs In The Conversation
For small owner-operated businesses, valuation usually centers on seller's discretionary earnings, or SDE. SDE starts with business earnings and adjusts for properly documented owner benefits, non-recurring expenses, discretionary expenses, and other add-backs.
This matters because net income can understate what the business produces for an owner, while gross margin can overstate how comfortable the business really is.
SDE margin gives you a practical bridge. It asks: after product cost and the real operating burden, how much owner earnings does the business create as a percentage of sales?
Among businesses in our database, the SDE-margin bands tell a cleaner valuation story than gross margin alone. Businesses under 10% SDE margin averaged a 1.65x derived SDE multiple. The 20% to 29% SDE-margin band averaged 2.43x. The 40%+ SDE-margin band averaged 2.60x.
The movement isn't dramatic at every step. That is part of the point.
Once a business shows healthy owner earnings, the multiple starts depending on other things too: age, growth, concentration risk, transferability, account health, documentation, and whether the buyer trusts the story in the P&L. A high SDE margin helps. It doesn't erase the rest of the business.
The Leak Between Gross Margin And Net Margin
The most interesting cases sit in the gap.
We found 298 businesses with 40%+ gross margin and under 20% SDE margin. They averaged 58.7% gross margin, 12.8% SDE margin, and a 2.29x derived SDE multiple.
We also found 612 businesses with under 40% gross margin and 30%+ SDE margin. They averaged 34.8% gross margin, 33.2% SDE margin, and a 2.45x derived multiple.
That second group is easy to underappreciate if you are only staring at product margin. A 34.8% gross margin doesn't sound as pretty as 58.7%. But if the business keeps nearly all of it after operating expense, the owner-earnings picture can be better.
This is where the phrase "gross margin vs net margin" becomes useful. The question isn't which number is more correct. The question is what each number is allowed to answer.
Gross margin answers: does the product have room?
Net margin answers: did the business keep the room?
SDE margin answers: what does the owner-operated business produce in a form a buyer can value?
Scale Makes The Comparison Messier
Small businesses often look cleaner on margin percentages.
In our data, businesses under $100K in annual revenue averaged 50.8% gross margin and 42.8% SDE margin. Businesses over $1M averaged 42.4% gross margin and 32.5% SDE margin.
At first pass, the smaller group looks more attractive. Higher margin. Lighter structure. Fewer moving parts.
Then the multiple shows up and ruins the neat answer. The under-$100K group averaged a 2.01x derived SDE multiple. The $1M+ group averaged 2.61x.
Of course it did.
Scale changes risk. A seven-figure business with slightly lower margins may have more proof of demand, more stable supplier relationships, better transferability, deeper history, and less "one weird month wrecked the whole story" energy. A tiny business can look beautiful on percentage margin and still be fragile because the base is small.
This is one reason gross margin screenshots can be misleading. They can make a small business look wonderfully efficient while hiding the fact that there isn't much business yet.
When Gross Margin Is Still The Number To Watch
Gross margin is the first alarm for product economics.
If supplier cost changes, freight jumps, referral fees move, packaging gets heavier, or a coupon strategy becomes permanent, gross margin catches the pressure before net margin tells the whole story. It also helps separate a product problem from an operating problem.
This is where clean COGS treatment matters. Cash-basis inventory accounting can make gross margin jump around for reasons that have little to do with the products sold that month. Accrual-based COGS gives the number a fighting chance. We covered the recognition side in more detail in Amazon FBA cost of goods sold explained.
There is a small scar here. We have seen competent operators get embarrassed by this. Not because they were careless, but because inventory businesses punish casual timing. A container paid for in October, units sold in January, reimbursement received in March, and a supplier credit applied in May can turn a clean-looking P&L into something that requires a cup of coffee and a second monitor.
Get the COGS right first. Then gross margin can speak.
How To Read Gross Margin And Net Margin Together
Use gross margin as the product test. Use net margin as the operating test. Use SDE margin as the valuation test.
A simple review looks like this:
- Calculate gross margin from revenue and landed COGS.
- Calculate net margin after operating expenses.
- Calculate SDE margin after valid owner add-backs and adjustments.
- Compare the spread between the three numbers.
- Investigate any month where the spread changes without a clear operating reason.
The spread is the part to study. A 46% gross margin and 37% SDE margin is close to the average pattern in our database. A 59% gross margin and 13% SDE margin is a different animal. It may still be a good business, but the explanation has to come from somewhere.
For sellers, this gives you a better way to prepare before a valuation. For buyers, it gives you a cleaner first pass before you start asking about account health, SKU concentration, and transferability.
Start with the margin. Stay for the leak.
FAQ
What is the difference between gross margin and net margin for Amazon FBA?
Gross margin measures revenue left after product cost, usually landed COGS. Net margin measures what remains after operating expenses. For valuation work, SDE margin often matters even more because it shows owner earnings as a percentage of sales.
Is gross margin or net margin more important?
Gross margin is better for understanding product economics. Net margin is better for understanding operating efficiency. SDE margin is usually better for valuation because small owner-operated businesses are commonly valued from seller's discretionary earnings.
What is a good Amazon FBA gross margin?
Many FBA businesses become healthier around the 30% to 40% gross-margin range, and 40%+ is usually strong. The number still needs context from category, scale, operating expense, inventory speed, and SDE margin.
Why can a high gross margin business have a weak net margin?
The business may need heavy advertising, contractors, software, storage, returns processing, or other operating expense to generate sales. High gross margin gives the business room. Operating expenses decide how much room survives.
Should I use net margin or SDE margin when preparing to sell?
Use both, but don't stop at net margin. SDE margin is usually more useful for an owner-operated business because it adjusts for properly documented owner benefits, non-recurring expenses, and discretionary add-backs. For the formula and add-back logic, see Seller's Discretionary Earnings explained.
Curious what your business is worth?
Get a free, instant valuation and see how your Amazon business stacks up.
Get Your Free Valuation