Amazon Seller Central Metrics Explained: The Dashboard Only Helps If You Know What It Is Measuring
The FBA Guys
May 30, 2026

Seller Central can make a good business look chaotic because it shows you traffic in one place, conversion in another, account health somewhere else, inventory pressure in a different report, and then sends the settlement report along later to remind everyone that revenue and cash aren't the same creature.
What should you actually do with all of it?
Here is the useful version of Amazon Seller Central metrics explained: the metrics matter when they tell you why the business is behaving the way it is. Sessions show demand. Unit session percentage shows conversion. Buy Box percentage shows whether your offer can actually capture the demand. Account health shows platform risk. Inventory metrics show whether cash is stuck in the wrong place. Reviews show defensibility.
Read that way, the dashboard stops being a scoreboard and becomes a map of causes.
Start With Demand: Sessions, Page Views, and Ordered Product Sales
The first group of Seller Central metrics tells you whether people are reaching the listing and whether money is moving through it. Sessions are visits. Page views are product-page loads. Ordered product sales are the dollar value of products ordered during the period you selected. Amazon's Sales and Traffic Business Report includes sales performance and traffic metrics such as ordered product sales, units ordered, page views, and Buy Box percentage, according to Amazon's Selling Partner API documentation.
Those numbers are useful, but only when you keep them in the right order.
Traffic comes first. Sales comes later. Profit comes later still, and profit is where a lot of cheerful dashboard stories get quietly embarrassed by freight, returns, coupons, storage, and the small line items nobody wanted to sort on a Thursday afternoon.
A product with rising sessions and flat sales is usually giving you a different problem than a product with falling sessions and stable unit session percentage. In the first case, demand is arriving and failing to convert. In the second, conversion may be fine while visibility is fading. The fixes are completely different, which is why "sales are down" is too blunt to be useful.
What changed first: traffic, conversion, Buy Box, price, ad spend, reviews, or inventory availability?
We see the same principle in valuation work. Revenue trend is still one of the cleanest signals in the FBA Guys valuation database. Businesses marked as "declined a lot" averaged a 1.66x estimated SDE multiple across 207 valuations. Stable businesses averaged 2.37x across 2,133 valuations, and increased businesses averaged 2.54x across 3,487.
Trend doesn't explain everything, but it tells you where to start asking questions.
Unit Session Percentage Is the Conversion Metric Sellers Usually Mean
Unit session percentage is Amazon's version of conversion rate. It measures units ordered divided by sessions, expressed as a percentage. If an ASIN receives 1,000 sessions and sells 120 units, the unit session percentage is 12%.
Simple enough, right?
The trouble starts when you treat that percentage as a grade instead of a clue. A low unit session percentage can come from weak images, bad price positioning, poor reviews, confusing variations, lost Featured Offer placement, or traffic from ads that never should have been pointed at that ASIN in the first place. Same number. Different cause.
This is where Seller Central gets a little mean. It gives you enough data to see the symptom, then makes you do the adult work of finding the source.
Look at unit session percentage beside sessions, Buy Box percentage, price, ad mix, and review movement. A product with low conversion and 99% Buy Box control is probably asking for listing or offer work. A product with low conversion and 52% Buy Box control may not have a conversion problem at all. It may have an ownership problem on the sale button.
Would you rewrite the listing before checking whether you are even getting the sale button often enough?
There is also a timing issue. A one-week conversion dip after a price test isn't the same as a three-month slide across your best ASINs. One is a bruise. The other is a pattern, and patterns deserve a calmer look than a dashboard panic can usually provide.
Buy Box Percentage Shows Whether You Control the Sale
Amazon now uses the term Featured Offer for what sellers still usually call the Buy Box. It is the offer area on the product detail page with the main Add to Cart and Buy Now buttons. Amazon says Featured Offers are selected using factors such as competitive pricing, shipping speed, order experience, and stock availability.
Buy Box percentage measures how often your offer appears there.
This metric deserves more respect than it usually gets. A listing can have traffic, reviews, and a perfectly respectable conversion rate during the periods when you own the Featured Offer. Then another seller steps in, your Buy Box percentage drops, and the revenue line starts doing something strange.
In our newer valuation submissions, Buy Box rate is one of the cleaner operating signals. Businesses with 90%+ Buy Box rate averaged a 2.95x estimated SDE multiple across 244 valuations. Businesses below 50% averaged 1.81x across 19 valuations.
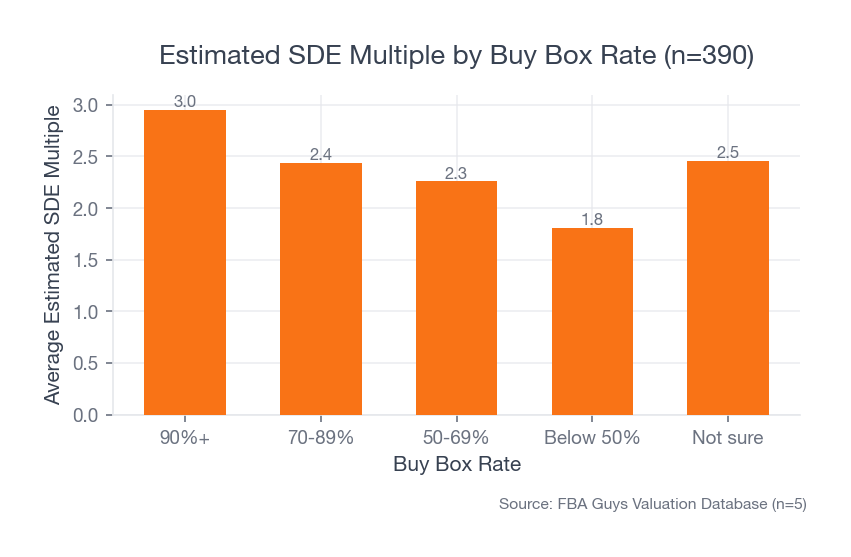 Source: FBA Guys Valuation Database (n=390)
That gap is too large to wave away as dashboard trivia.
The sample is smaller than we would like, so we wouldn't build a full valuation model on Buy Box alone. Still, the direction makes practical sense. When the seller can't reliably own the sale button, future revenue becomes harder to trust. A buyer has to ask whether revenue belongs to the brand, the listing, the price, or simply the seller who happened to be winning the offer during the measurement period.
What happens if that advantage doesn't transfer?
Account Health Is the Risk Dashboard
Account health is where Seller Central stops being analytical and starts feeling like a smoke detector. As of the writing of this article, Amazon describes Account Health Rating as a color-coded score from 0 to 1,000 that helps sellers assess risk of deactivation. Amazon also names order defect rate, late shipment rate, cancellation rate, valid tracking rate, and on-time delivery rate as account performance metrics sellers should watch, especially for seller-fulfilled orders.
If you are mostly FBA, some shipping metrics may not drive the business day to day. Account health still matters because platform risk isn't theoretical on Amazon. A business can have beautiful margins and still become difficult to value if the account has unresolved policy violations, recent suspensions, review manipulation issues, or a pattern of performance warnings.
The fact is, account health gets checked because it can change the buyer's risk picture before anyone gets deep into the P&L.
Our data only has account-health fields for 390 valuations, so treat the numbers as directional. Healthy-high accounts averaged a 2.94x estimated SDE multiple across 121 valuations. Healthy-mid accounts averaged 2.87x across 79. Healthy-low accounts averaged 2.54x across 179.
The odd little group was "not sure."
Those ten businesses averaged 1.75x. Small sample, certainly. Still interesting. Not knowing your account-health picture can be its own signal because it suggests the seller may not have a steady metric review habit, which means a buyer has to wonder what else is being noticed late.
That is a scar most operators recognize. You open Seller Central for one thing, see a yellow warning in a corner you haven't visited in weeks, and feel your stomach drop before you even know whether the issue is serious. The metric didn't create the problem. It exposed the gap in the routine.
Inventory Metrics Are Cash-Flow Metrics Wearing a Warehouse Uniform
Inventory metrics look operational. They are financial.
Your Inventory Performance Index, sell-through rate, excess inventory, aged inventory, stranded inventory, and FBA capacity signals all point toward the same broad question: is the right amount of cash sitting in the right products at the right time?
That question matters because inventory is where Amazon businesses quietly hide both strength and weakness. Too little inventory creates stockouts, lost sales, and sometimes lost Featured Offer eligibility. Too much inventory ties up working capital, creates storage costs, and teaches everyone to believe the shelf is healthier than the bank account.
We have IPI-style fields for 350 valuations. Businesses marked excellent averaged a 2.95x estimated SDE multiple across 176 valuations. Good averaged 2.75x across 120. Acceptable averaged 2.36x across 29. At-risk averaged 2.09x across only 8, so that final bucket is thin, but the slope is exactly what you would expect.
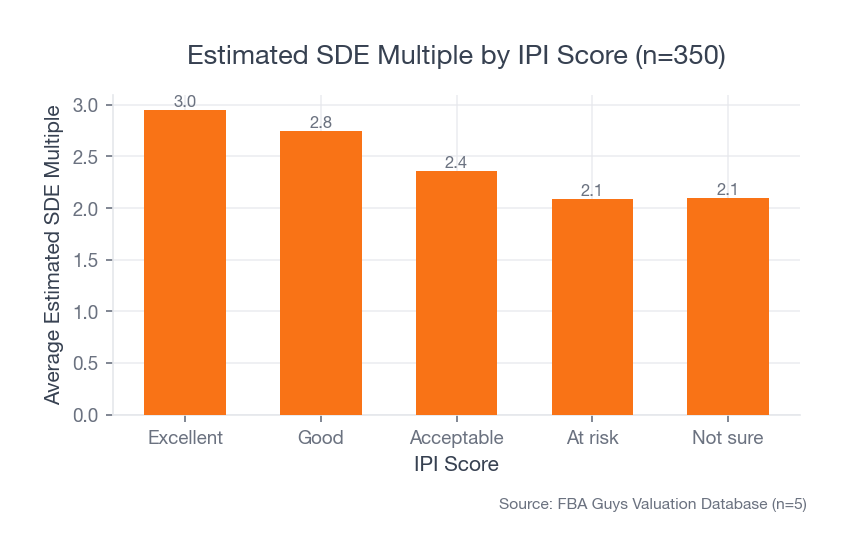 Source: FBA Guys Valuation Database (n=350)
Inventory discipline doesn't just protect fees. It protects the story of the business.
If sales rose because you pushed inventory into FBA and then let it age, the dashboard may look good for a while. If sales fell because your best SKU stocked out for seventeen days during a demand spike, the P&L will show the bruise, but Seller Central will usually explain the bruise. A buyer, lender, or serious operator wants the explanation, which is why Amazon FBA inventory management belongs in the same conversation as revenue.
Without it, they fill in the blank themselves.
Reviews: Read Count Before You Worship the Score
Review score gets the attention because stars are easy to look at. Review count usually tells the more durable story, and the distinction between seller feedback and product reviews matters when you are diagnosing the source of a reputation problem.
In the FBA Guys valuation database, review count moves in a fairly clean line. Businesses with fewer than 50 reviews averaged a 2.03x estimated SDE multiple across 1,341 valuations. Businesses with 50-199 reviews averaged 2.36x across 1,499. Businesses with 200-999 reviews averaged 2.53x across 2,338. Businesses with 1,000+ reviews averaged 2.66x across 2,794.
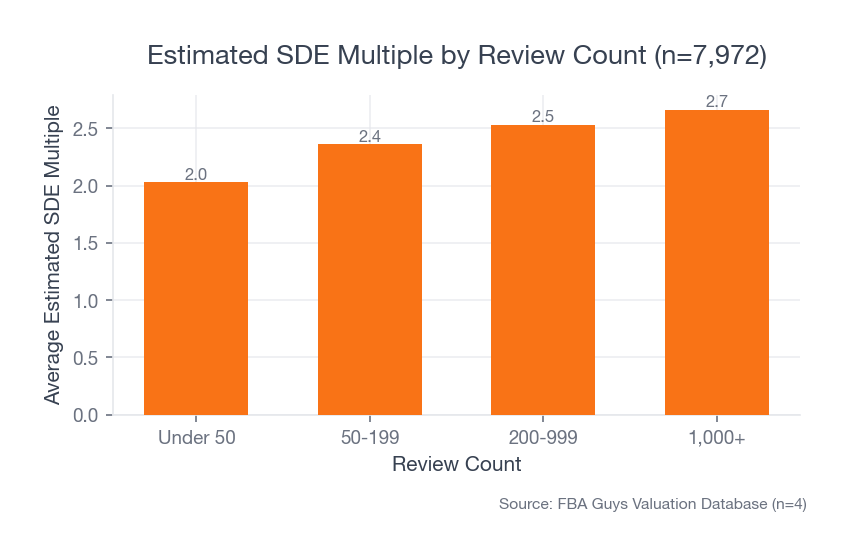 Source: FBA Guys Valuation Database (n=7,972)
Review score was messier. Businesses in the 4.3-4.59 bucket averaged 2.46x across 5,536 valuations. Businesses at 4.6+ averaged 2.32x across 1,809.
Do we read that as "higher star ratings hurt value"? No. Category mix, product maturity, review depth, and price point can all distort the simple score. The better interpretation is narrower: score alone is a thin metric. Count gives you some indication of market proof and review moat. Score tells you whether the moat is clean or getting muddy.
Of course, a high review count with a slipping score can point to a product problem. A low review count with a perfect score can be fragile. A mature ASIN at 4.4 stars with thousands of reviews may be a healthier asset than a new ASIN at 4.9 stars with 38 reviews and one oddly enthusiastic paragraph from someone's cousin.
Messy detail? Look at the one-star reviews that mention the same defect in different words. "Lid cracked." "Cap split." "Arrived leaking." Three customers, same product issue, none of them using the language you used in the listing. That is usually more useful than the average star rating.
Advertising Metrics Need the Financials Beside Them
Seller Central and Amazon Ads give you plenty of ad metrics: impressions, clicks, click-through rate, cost per click, conversion rate, advertising cost of sales, return on ad spend, and campaign-level sales. ACoS is the one sellers tend to obsess over. TACoS is usually the one that belongs in the weekly business conversation.
Why?
ACoS compares ad spend to ad-attributed sales. TACoS compares ad spend to total sales. If ACoS rises while TACoS stays steady, the business may simply be using ads to drive incremental growth. If ACoS looks fine while TACoS keeps rising, ads may be replacing organic demand. The second scenario is more interesting, and less comfortable.
This is where Seller Central metrics need the P&L. A campaign can look efficient inside Amazon Ads while the business loses contribution margin after FBA fees, referral fees, returns, coupons, freight, prep, and storage. We shouldn't have to keep saying this, but the dashboard revenue number doesn't know your landed cost discipline.
Tie ads to gross margin, contribution margin, and cash flow. Otherwise, you are measuring the campaign in one room and paying for it in another.
The Metrics Buyers Care About
If you are reading Seller Central only as an operator, the dashboard tells you what to fix this week. If you are reading it as someone who may sell someday, the dashboard tells you what the next owner will need to believe.
The two views overlap more than sellers expect. A buyer wants to know whether demand is real, whether conversion is stable, whether the seller controls the sale, whether account health is clean, whether inventory can transfer without a cash surprise, and whether reviews make the brand defensible. Those are Seller Central questions before they are Amazon FBA business valuation questions.
The Playbook framework calls the big categories risk, growth, transferability, and documentation. Seller Central metrics touch all four:
- Risk: account health, policy violations, Buy Box loss, review trend, refund patterns.
- Growth: sessions, unit session percentage, ordered product sales, ad efficiency, repeat purchase indicators.
- Transferability: SKU concentration, inventory planning, supplier and fulfillment routines, documented reporting.
- Documentation: exported reports that reconcile with the P&L, inventory records, settlement data, and monthly dashboards.
A monthly export habit is boring. Good.
Boring is what lets someone else understand the business without trusting your memory.
A Simple Weekly Seller Central Metrics Review
Here is a practical weekly review that won't turn your Friday into a séance with spreadsheets.
Start with account health. Look for new warnings, policy issues, performance movement, or anything that needs a same-day response. This is the smoke detector pass.
Then review sales and traffic by parent ASIN. For each important ASIN, track sessions, unit session percentage, ordered product sales, units ordered, Buy Box percentage, and price. You are looking for cause combinations, not isolated numbers.
Next, review inventory. Check stockout risk, excess inventory, stranded inventory, aged inventory, sell-through, and capacity constraints. Mark any ASIN where sales performance and inventory position disagree. The annoying ASIN with only six units left and 41 days of manufacturing lead time deserves more attention than the pretty chart on the dashboard.
Then review advertising. Track spend, ACoS, TACoS, campaign conversion, and ad-attributed sales beside gross margin and contribution margin. If you can't connect ad performance to margin, pause before calling the campaign good. This is also why a recurring weekly KPI review beats a last-minute dashboard scramble.
Finally, write one sentence for each major change.
Not a report. One sentence.
"Sessions rose 18% on ASIN B after coupon launch, but unit session percentage fell from 11.2% to 8.4% and Buy Box stayed at 96%."
That sentence is useful. It gives next week a starting point. It gives a future buyer a trail. It gives you a chance to remember what happened before the month-end P&L turns the whole story into one blended number.
The Point of Seller Central Metrics
Amazon Seller Central metrics explained badly become a glossary. Seller Central metrics explained well become a diagnostic system.
The dashboard tells you where demand is coming from, where it leaks, where Amazon sees platform risk, where inventory is swallowing cash, and where the brand has enough market proof to survive scrutiny. No single metric deserves to run the business. The combinations do the work.
The best operators don't stare at every number every day. They build a rhythm that catches the metrics that can change the business before the P&L finally admits what happened.
Sometimes that means a conversion fix. Sometimes it means inventory. Sometimes it means the Buy Box quietly told the truth two weeks before revenue did.
FAQ
What are the most important Amazon Seller Central metrics?
The most important Amazon Seller Central metrics are sessions, unit session percentage, ordered product sales, Buy Box percentage, account health, inventory performance, review count, review score, refund patterns, and advertising efficiency. The useful set depends on the decision you are making. For weekly operations, start with account health, sales and traffic, inventory, and ads.
What is unit session percentage in Seller Central?
Unit session percentage is units ordered divided by sessions, expressed as a percentage. It is the closest Seller Central metric to product-page conversion rate. Read it beside traffic, Buy Box percentage, price, and reviews because the same conversion number can come from very different causes.
Why does Buy Box percentage matter so much?
Buy Box percentage matters because it shows whether your offer is consistently appearing in the main purchase area on the product page. In our newer valuation data, businesses with 90%+ Buy Box rate averaged a 2.95x estimated SDE multiple, while below-50% Buy Box businesses averaged 1.81x. Small sample in the low bucket, but a very sensible signal.
Which Seller Central metrics matter most for valuation?
The Seller Central metrics that matter most for valuation are the ones that explain risk, growth, transferability, and documentation. Account health, Buy Box percentage, revenue trend, inventory discipline, review depth, advertising efficiency, and clean monthly exports all help an outside party understand whether the business is durable.
How often should Amazon sellers review Seller Central metrics?
Review account health at least weekly, and more often if there is an active issue. Review sales, traffic, Buy Box, inventory, and ads weekly for key ASINs. Do a deeper monthly review when the P&L is available so Seller Central performance reconciles with actual margin and cash flow.
Curious what your business is worth?
Get a free, instant valuation and see how your Amazon business stacks up.
Get Your Free Valuation