Amazon FBA KPIs to Track Weekly: The Numbers That Deserve a Standing Meeting
The FBA Guys
May 15, 2026

Most Amazon dashboards are too eager.
They will show you sales, sessions, conversion rate, ad spend, TACoS, inventory warnings, refund rate, account health, Buy Box percentage, units ordered, gross margin, settlement cash, and several charts with colors chosen by someone who has never had to fund a purchase order on a Thursday afternoon.
Then the week ends and the owner still has one question.
What changed enough that we need to act?
The Amazon FBA KPIs to track weekly are the numbers that change operating decisions before month end: net sales trend, contribution margin, TACoS, inventory weeks of cover, stockout risk, aged inventory, Buy Box percentage, unit session percentage, refund rate, account health, repeat order rate, and a rolling SDE margin estimate. The list is not short because the business is simple. It is short because the week is noisy.
The fact is, a weekly review should not try to close the books. That is monthly work. Weekly KPIs should tell you whether the business is drifting into a cash problem, a margin problem, an inventory problem, an advertising problem, or an Amazon account problem while there is still time to do something besides admire the chart.
The Weekly KPI List Should Be Shorter Than the Dashboard
Start with this rule: if a number doesn't change a decision this week, it doesn't belong in the weekly review.
It can still live somewhere. A dashboard can hold more detail than a meeting can. But the weekly view needs discipline. Too many numbers make the operator feel informed while quietly hiding the one thing that moved.
We like a weekly Amazon FBA dashboard with four sections:
- Sales and demand
- Margin and advertising
- Inventory and cash
- Account quality and customer signals
That structure keeps the review from turning into a Seller Central sightseeing tour.
Amazon's Seller Central tools page points sellers toward tools for sales trends, inventory, payments, account health, reviews, and FBA programs. That is useful. As of the writing of this article, Amazon's inventory tools also surface sell-through rates, aging stock alerts, restock guidance, and inventory performance signals.
The weekly review is where those platform metrics meet the financial ones.
1. Net Sales and Sales Trend
Track net sales, not just ordered product sales.
Ordered sales tell you what customers bought. Net sales tell you what survived refunds, discounts, promotions, and adjustments. For a weekly review, you can still look at ordered sales because it moves faster. Just don't let it pretend to be the whole answer.
The useful view is week over week, same week last year, and trailing four weeks. A single week can be strange. Two weeks can be a promotion. Four weeks starts to whisper.
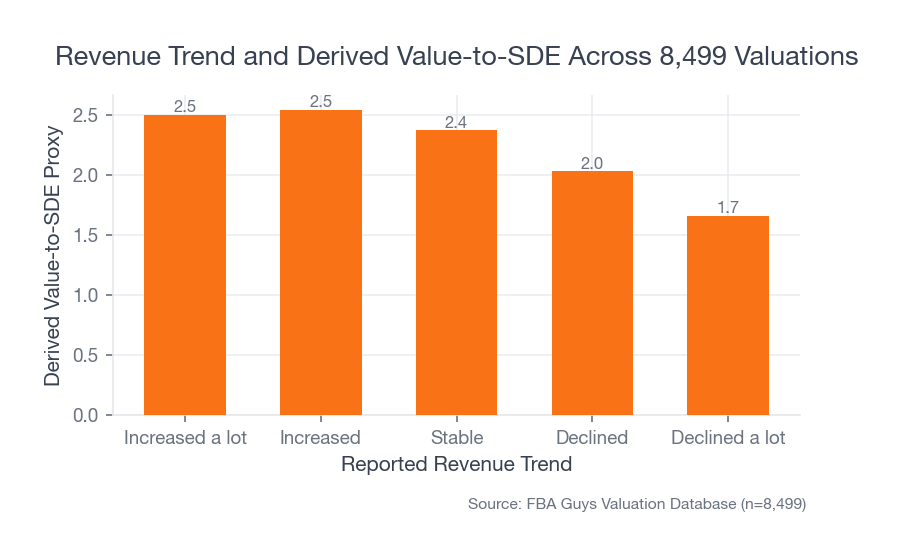
Our valuation database shows why the trend matters, but also why it needs company. Businesses marked "increased" averaged a 2.54 derived value-to-SDE proxy. Stable businesses averaged 2.37. Declining businesses averaged 2.03, and businesses marked "declined a lot" averaged 1.66. That direction is not surprising.
 Source: FBA Guys Valuation Database (n=8,499)
The more interesting read appears when trend meets margin. Declining businesses averaged 47.2% gross margin, higher than the 44.7% average for businesses marked "increased." Businesses marked "declined a lot" averaged 52.1% gross margin and still had the weakest derived value-to-SDE proxy in the trend query.
Growth is a good weekly signal. Growth with no earnings underneath it starts asking for more evidence.
2. Contribution Margin
Contribution margin is the amount left after the costs that move with the sale. For Amazon FBA, that usually means product cost, Amazon referral fees, FBA fulfillment, inbound freight or placement allocation, storage allocation, refunds, promotions, and advertising. Our contribution margin guide goes deeper on this layer.
Weekly contribution margin is not always perfect. Fine.
It should still be directionally useful. If landed cost moved, FBA fees changed, ads became more expensive, or a coupon started carrying the conversion rate, the weekly review should show the pressure before the monthly P&L explains the damage. If the fee side is the unclear part, start with the FBA fulfillment fee breakdown.
Here is the small scar in this topic: margin analysis always looks cleaner after the month closes. Weekly work has estimates, lagging fees, delayed refunds, and little timing problems. That makes it tempting to leave margin alone until the books are final. The database pushed us away from that comfort. In the trend query, declining businesses had stronger average gross margin than growing businesses and still showed a weaker derived value-to-SDE profile.
No one needs a perfect weekly SDE calculation to see that margin discipline belongs in the week, not just in the month.
3. TACoS and Ad Spend Efficiency
TACoS is ad spend divided by total sales.
Amazon's ACOS guide defines ACOS as ad spend divided by ad revenue. ACOS tells you how paid campaigns performed against attributed ad sales. TACoS tells you how much advertising the whole revenue base needed. For a weekly operating review, TACoS usually deserves the seat closest to contribution margin. We cover the formula in more detail in how to calculate TACoS for Amazon PPC.
Watch TACoS by account and by product family. A total account TACoS can look stable while one SKU is buying its sales at a price the business cannot carry. A product-level view shows where the campaign is feeding a real asset and where it is renting demand for a week.
The weekly question is practical: did ads buy profitable demand, defend rank, launch a product, or cover a listing problem?
That last one is where the report gets uncomfortable. If traffic is fine, conversion is weak, and ad spend is rising, the KPI list should make you look at the listing before you raise bids again.
4. Inventory Weeks of Cover
Inventory weeks of cover is current sellable inventory divided by recent weekly unit sales.
Simple number. Strange consequences.
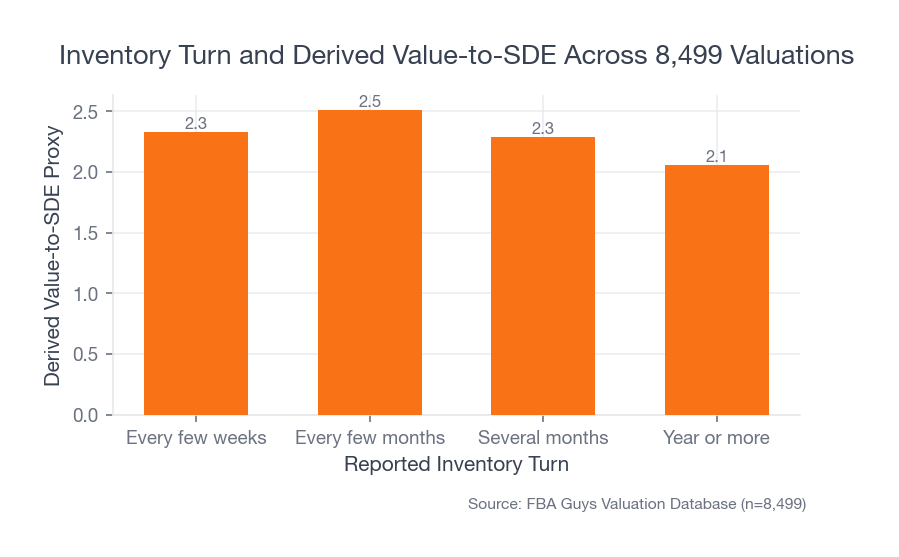
In the valuation database, businesses reporting year-or-more inventory turns averaged 53.8% gross margin, the highest margin among the inventory-turn groups. They also averaged the weakest derived value-to-SDE proxy at 2.06. Businesses turning inventory every few months averaged lower gross margin at 44.8%, but a stronger 2.51 derived value-to-SDE proxy.
 Source: FBA Guys Valuation Database (n=8,499)
That result is awkward in a useful way. The slowest-turning group did not look weak on margin. The issue was the cash and time tied up behind the operation.
Track weeks of cover for each meaningful SKU or product family. Also track inbound inventory separately from sellable inventory. A container on the water is not the same as stock Amazon can ship tonight, even if the spreadsheet feels calmer when the units sit in one column.
(There is always one tab named "Inventory Final." It is rarely final.)
5. Stockout and Aged Inventory Risk
Stockout risk and aged inventory risk belong together because they are opposite ways of being wrong.
Too little inventory gives away ranking, sales, and advertising momentum. Too much inventory traps cash, raises storage exposure, and forces decisions later when the options are worse. The storage-fee breakdown covers why monthly storage and aged inventory charges measure different problems.
Weekly, track:
- SKUs projected to stock out within 30 days
- SKUs above the target weeks-of-cover range
- Units approaching aged inventory thresholds
- Stranded or unsellable inventory
- Inbound shipments delayed against plan
Amazon's inventory tools can help here. As of the writing of this article, Amazon says its FBA inventory tools include KPI cards for FBA sales ordered, units ordered, order count, and FBA fees, along with IPI components such as excess inventory, in-stock rate, sell-through, and stranded inventory. Use those inputs. Then translate them into the owner's question: which SKU needs money, attention, or a hard call this week?
The hard call is usually the slow mover. It has five good reasons to stay in the catalog and one quiet reason it shouldn't: the cash is better somewhere else.
6. Buy Box, Traffic, and Unit Session Percentage
This section is here because Amazon is still a marketplace before it is a P&L.
Track sessions, unit session percentage, and Buy Box percentage weekly. Sessions tell you whether traffic is arriving. Unit session percentage tells you whether visitors are buying. Buy Box percentage tells you how often your offer is actually in position to win the order.
Seller Central gives operators the tools to track sales, trends, inventory, customer service, account health, and advertising-related performance. Those are not finance metrics by themselves, but they explain why finance metrics moved.
The useful pattern is the combination:
- Sessions up, unit session percentage down: traffic quality, pricing, listing, review, or offer issue
- Sessions down, unit session percentage stable: demand or ranking issue
- Buy Box percentage down: price, fulfillment, account, hijacker, or offer competitiveness issue
- Sales up, contribution margin down: growth is leaning on discounts, ads, or fees
One number rarely tells the story. Three numbers can make the next action obvious.
7. Refund Rate and Review Signals
Refund rate is a weekly KPI because quality problems rarely wait politely for the month-end close.
Track refund rate by SKU, return reasons, negative review rate, review score movement, and any product quality complaint that repeats. A one-off return is noise. The same complaint showing up three times in a week deserves attention, especially if the SKU has meaningful velocity.
This is not only customer service. It is margin, inventory, ranking, and valuation quality sitting in the same room.
A product with rising returns can lose the FBA fee, trigger handling costs, damage reviews, create stranded inventory, and make every ad dollar less efficient next week.
8. Account Health
Account health gets a weekly review because the downside is lopsided.
As of the writing of this article, Amazon gives sellers an Account Health area in Seller Central and surfaces policy, customer service, and fulfillment-related signals there. The exact scoring and enforcement details can change, so the habit matters more than memorizing a static threshold.
Weekly, review:
- Account Health Rating and policy warnings
- Order Defect Rate
- Late shipment or fulfillment metrics where relevant
- Valid tracking or cancellation metrics where relevant
- Product compliance and IP notices
- Suppressed listings
For FBA-heavy private label sellers, some fulfillment metrics may matter less than they do for seller-fulfilled orders. Account health still deserves a standing place because a single ignored warning can become the most important business metric very quickly.
We would rather see one boring line in the weekly review that says "no change" than discover three weeks later that someone assumed another person checked it.
9. Repeat Order Rate
Repeat order rate tells you whether the business has to buy every sale from scratch.
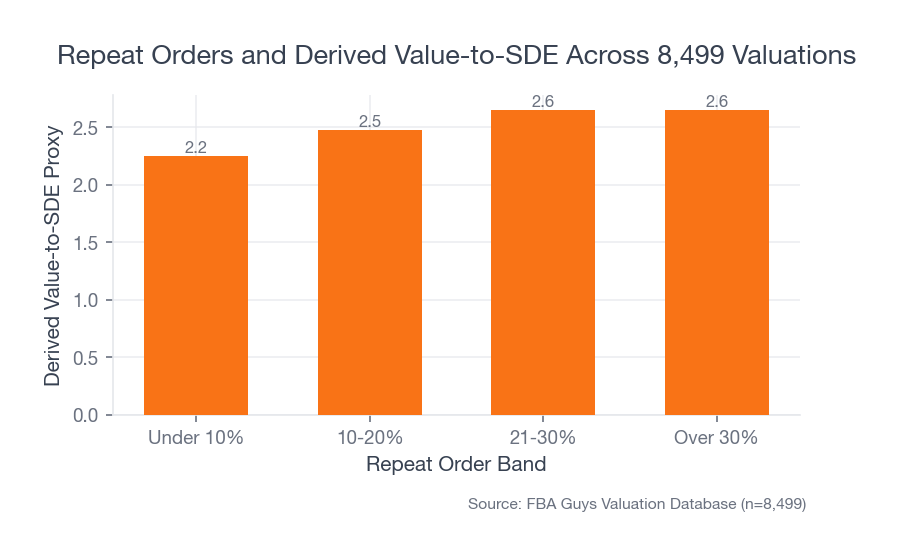
In the valuation database, businesses with less than 10% repeat orders averaged a 2.24 derived value-to-SDE proxy. Businesses in the 21-30% repeat order bucket averaged 2.65. Businesses over 30% averaged 2.66. That is not a clean causal claim. Bigger, better businesses may also be more likely to have repeat demand.
 Source: FBA Guys Valuation Database (n=8,499)
Still, the signal is worth watching.
For replenishable products, track repeat purchase rate, Subscribe and Save participation where applicable, customer reorder intervals, and cohort behavior if your tools support it. For non-replenishable products, look for adjacent repeat behavior: accessories, bundles, replacement parts, seasonal repurchase, and branded search growth.
The weekly read is not "did everyone come back?" It is whether the account is building demand that gets easier to serve over time.
10. Rolling SDE Margin
SDE means Seller's Discretionary Earnings. It is net income plus valid owner add-backs over a defined period, and it is the earnings base commonly used to value owner-operated FBA businesses. For the full calculation, see how to calculate SDE for an Amazon business.
A final SDE calculation is monthly work. Weekly, use a rolling estimate:
Estimated SDE margin = estimated SDE / net sales
The point is not precision to the penny. The point is keeping the weekly conversation connected to business value.
This is where many weekly dashboards go soft. They show revenue, ads, and inventory, but they don't show whether owner earnings are improving. The Playbook material is blunt on this point: monthly P&Ls, accrual accounting, clean financials, and key metric tracking all shape how the business can be understood later.
The weekly SDE estimate is a bridge. It keeps operators from celebrating a week that made the account busier and the business thinner.
The Weekly Review Rhythm
The weekly review should take 30 minutes.
Use the same day, the same scorecard, and the same comparison periods. Review trailing 7 days, prior 7 days, same week last year if seasonality matters, and trailing 4 weeks.
Then ask five questions:
- What changed?
- Is it demand, margin, inventory, advertising, or account quality?
- Does the change require action this week?
- Who owns the action?
- What would make us reverse the decision next week?
The last question matters. A weekly KPI review should create decisions with expiration dates. Raise bids for seven days. Pause the coupon for one week. Send the supplier email by Friday. Move 300 units to removal, not "look at aged inventory soon."
Soon is where old inventory goes to become a fee.
A Simple Weekly Amazon FBA KPI Scorecard
Use this as the starting scorecard:
| Category | Weekly KPI | Why it matters |
|---|---|---|
| Sales | Net sales and trailing 4-week trend | Shows demand direction without overreacting to one day |
| Sales | Sessions and unit session percentage | Separates traffic problems from conversion problems |
| Offer | Buy Box percentage | Shows whether your offer is in position to win |
| Margin | Contribution margin | Shows whether sales are worth having |
| Ads | TACoS and ad spend by product family | Shows whether growth is paid for responsibly |
| Inventory | Weeks of cover | Shows stockout and overstock risk |
| Inventory | Aged and stranded inventory | Shows cash and fee exposure |
| Quality | Refund rate and return reasons | Shows product or listing problems early |
| Account | Account Health Rating and warnings | Shows platform risk before it becomes urgent |
| Retention | Repeat order rate | Shows whether demand is getting easier or harder |
| Value | Rolling SDE margin estimate | Connects weekly operation to business value |
Keep comments beside the numbers. A dashboard without notes becomes a memory test.
FAQ
What are the most important Amazon FBA KPIs to track weekly?
The most important weekly Amazon FBA KPIs are net sales trend, contribution margin, TACoS, inventory weeks of cover, stockout risk, aged inventory, sessions, unit session percentage, Buy Box percentage, refund rate, account health, repeat order rate, and rolling SDE margin.
Should I track Amazon KPIs daily or weekly?
Check urgent alerts daily, especially account health, stockouts, suppressed listings, and major ad spend problems. Review operating KPIs weekly. Close financial KPIs monthly. Daily review catches fires. Weekly review changes decisions. Monthly review tells you what the business actually earned.
What is a good TACoS for Amazon FBA?
A good TACoS depends on margin, category, product maturity, repeat order behavior, and growth goals. A high TACoS can be acceptable during a launch if contribution margin and cash can support it. A low TACoS can still be bad if sales are shrinking and organic rank is fading.
How many KPIs should be on an Amazon seller dashboard?
The dashboard can hold more detail than the weekly meeting. The weekly scorecard should usually have 10-12 KPIs, each tied to a decision. If nobody can say what action a number would trigger, move it out of the weekly view.
Do weekly KPIs matter if I am not planning to sell?
Yes. The same numbers that make a business easier to value also make it easier to run. Clean margins, controlled inventory, stable account health, repeat demand, and a monthly SDE view are useful long before an exit conversation.
The Week Is Where Drift Shows Up
Monthly financials tell you what happened.
Weekly KPIs tell you where the business is starting to drift.
That is why the list needs to stay short, specific, and a little unforgiving. A good weekly review does not make the business feel more complicated. It makes the next decision harder to avoid.
Curious what your business is worth?
Get a free, instant valuation and see how your Amazon business stacks up.
Get Your Free Valuation