How to Calculate TACoS for Amazon PPC
The FBA Guys
March 16, 2026

You can calculate TACoS for Amazon PPC in one line:
TACoS = Ad Spend / Total Sales x 100
If you spent $8,000 on ads and generated $80,000 in total sales, your TACoS is 10%.
That part takes maybe twelve seconds.
The part that takes longer is staring at the number afterward and deciding whether it says "healthy support," "expensive growth," or "your ads are holding this thing together with duct tape."
In 210 successful valuations with usable advertising-spend data, the average ad-spend-to-sales ratio was 11.21%. That sounds neat. Almost responsible. Then you look at the spread: 42.9% of those businesses sat under 5%, while 19.5% ran above 20%.
Same metric. Very different businesses.
That is the whole article, really. TACoS is easy to calculate and much harder to read well.
How to Calculate TACoS for Amazon PPC
You need two numbers from the same date range:
- Total ad spend
- Total sales across the account
Same period. Same account. No shortcuts.
If you pull ad spend from the last 30 days and total sales from month-end accounting, you can make the formula behave politely while telling you almost nothing useful.
Here is the clean version:
$8,000 / $80,000 x 100 = 10%
TACoS uses total sales in the denominator because it is measuring total business dependence on ads. That is why it belongs in a broader management conversation. Once a listing matures, paid traffic, organic rank, price discipline, margin, and repeat demand start leaning on each other. TACoS gives you a quick read on how much paid traffic is carrying.
That is a different job from ACoS.
TACoS Formula Example: What the Number Is Actually Measuring
Say a product does $50,000 in total monthly sales.
$20,000 came directly from ad-attributed sales. Ad spend for the month was $6,000.
Your TACoS is 12%.
Your ACoS is 30%.
Put those beside each other for a second.
One says ads consumed 12% of total revenue. The other says ads consumed 30% of attributed ad revenue. Those are not competing answers. They are two camera angles on the same account.
And this is where sellers quietly drift off course.
They live in campaign dashboards all day, so they get very used to campaign questions. What is the click-through rate? What is the ACoS? Which ad group is bleeding? Useful questions. Necessary questions. But TACoS sits one floor above that. It asks whether the account as a whole is strengthening or whether paid traffic is doing more and more of the heavy lifting.
Our PPC profitability calculator follows the same logic:
ACoS = ad spend / ad salesTACoS = ad spend / total sales- break-even ACoS depends on unit margin before ad spend
Change the denominator and you change the question.
TACoS vs ACoS for Amazon PPC
Which one matters more?
That depends on what you are trying to fix.
Use ACoS when you are working on campaign efficiency. Amazon Ads defines it around ad-attributed sales, and that is exactly what it should do. If you are adjusting bids, looking at targeting, or trying to understand whether a campaign is paying for itself on attributed revenue, ACoS is the right tool.
Use TACoS when you want to know whether the business is building demand or renting it.
That distinction gets more important as the product gets older. Early in a launch, noisy ad efficiency can be perfectly rational. You are buying visibility. You are teaching Amazon where the product belongs. You are testing whether the listing has a pulse at all.
Later on, the standard should change.
A mature product with stable reviews and steady organic demand should not need the same kind of paid support forever. If TACoS keeps climbing anyway, something underneath the surface is changing. Perhaps margin tightened. Perhaps ranking softened. Perhaps the business got addicted to volume that only exists when ads are fully open.
The fact is, TACoS becomes a management metric once the product is established enough for organic demand to have a job.
What Our Valuation Data Says About a "Good" TACoS
Our valuation database cannot calculate true ACoS because it does not store ad-attributed sales. It can calculate the TACoS-style ratio directly because it stores advertising spend and total sales.
That is enough to make one important point: the range is wide.
Among the 210 successful valuations with usable ad-spend data:
- 42.9% sat under 5%
- 15.7% sat between 5% and 10%
- 13.8% sat between 10% and 15%
- 8.1% sat between 15% and 20%
- 19.5% sat above 20%
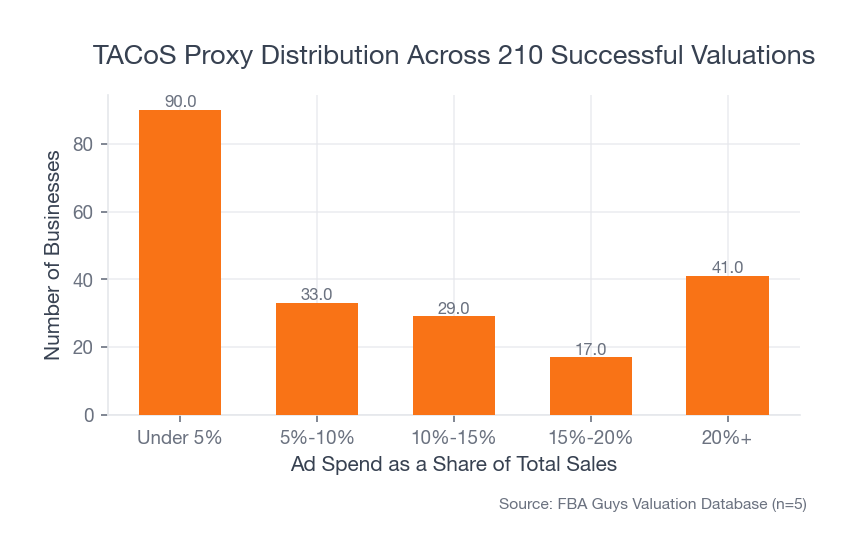 Source: FBA Guys Valuation Database (n=210)
If you were hoping for a universal benchmark, this is the moment it starts to fall apart.
Nearly half the sample sat under 5%. Nearly one-fifth sat above 20%. That is not a tidy market norm. That is a pile of businesses with different margins, different growth stages, different operating models, and different reasons for spending what they spend.
There is another detail in the data that is worth slowing down for.
Using an implied multiple derived from valuation divided by estimated earnings, the under-5% group averaged 2.46x. The 10%-15% group averaged 3.22x. The 20%+ group averaged 2.90x.
We paused on that the first time too.
Sellers like low TACoS because it feels disciplined. Buyers do not automatically reward the lowest-spend group. Sometimes low spend reflects real organic strength. Sometimes it reflects a seller who backed off before the business had much momentum to protect. Those two businesses can post the same ratio and deserve very different interpretations.
That is why "What is a good TACoS?" is usually the wrong first question.
A better one is: what kind of business is this ratio sitting inside?
Why Margin Changes the Answer
Start here if you want the number to become useful.
A 12% TACoS on a product with thick margins can be annoying and still survivable. A 12% TACoS on a product with thin margins, aggressive fees, and sloppy promo discipline can turn the P&L into a crime scene by month-end.
In our sample, businesses with 40%+ gross margin averaged a 12.87% TACoS-style ratio. Businesses in the 30%-40% gross-margin band averaged 6.67%.
That is not a rounding error.
High-margin businesses have room to buy traffic and still leave enough contribution behind to keep the economics attractive. Lower-margin businesses live closer to the guardrail. Every extra point of TACoS matters more there because there is less space for recovery once fees, returns, and discounting start piling on.
This is one reason TACoS discussions online get so sloppy. People compare one ratio across two completely different businesses as if the number should carry the same meaning in both. A supplement brand with repeat purchase behavior, 40%+ gross margin, and durable rank can sustain an ad load that would flatten a commodity product with shaky pricing power.
Same percentage. Different reality.
If you want the margin side of that conversation broken down more explicitly, how to calculate Amazon FBA profit margin is the better companion article. TACoS without margin context is a half-built sentence.
Revenue Stage Changes the Answer Too
The revenue bands in our sample form a U-shape:
- Under $100K in revenue: 13.06%
- $100K-$500K: 9.68%
- $500K-$1M: 9.41%
- $1M+: 12.03%
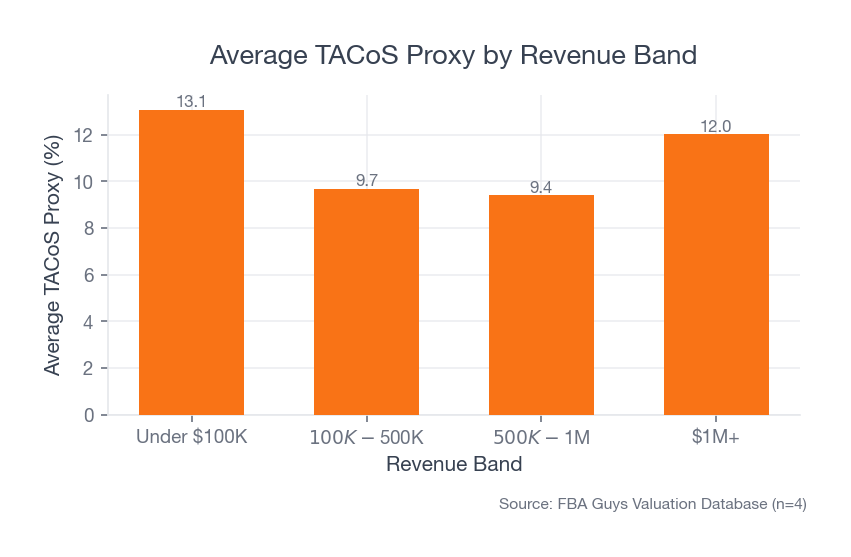 Source: FBA Guys Valuation Database (n=210)
There is a pretty intuitive story inside that shape.
Small businesses often spend hard because they are still trying to find traction. Big businesses often spend hard because defending rank at scale is expensive and losing share hurts immediately. The middle bands sometimes get a short stretch where established demand does more of the lifting.
It is not a law. It is just a pattern. Still, it is a useful one.
Fulfillment model nudges the ratio in the same way. FBA businesses in this sample averaged 13.56%, compared with 8.65% for FBM businesses and 7.72% for combination models. Different operating models create different ad habits, which is another reason benchmark advice gets shaky fast.
This part matters because sellers rarely ask for a benchmark that actually matches their stage. They ask for a clean number. The market keeps refusing to give them one.
Where Sellers Calculate TACoS Wrong
Most mistakes here are boring.
Unfortunately, boring mistakes compound beautifully.
The common ones:
- Using ad-attributed sales instead of total sales
- Pulling ad spend and total sales from different date ranges
- Treating TACoS like a complete profitability metric instead of one input
- Looking only at account-level TACoS when one SKU is doing all the damage
- Celebrating a lower TACoS while total sales are quietly fading
The fifth mistake is the one that causes the most self-congratulation.
A seller cuts spend, TACoS improves, the dashboard looks cleaner, and everybody relaxes for two weeks. Then the sales line starts to sag. Organic rank was weaker than it looked. The ratio improved because the business got smaller more efficiently.
That is not a win.
One more thing. A seller can calculate TACoS perfectly and still end up with the wrong conclusion if the accounting underneath it is a mess. Promo leakage, reimbursement noise, fee classification, and inventory timing still get a vote. We see this constantly in valuations. A metric that looks precise on the surface can be sitting on top of a P&L with an "Amazon Misc" line wandering between $400 and $1,200 a month because nobody bothered to classify the charges properly.
That kind of detail sounds small until a buyer starts asking questions.
The Practical Way to Use TACoS
Calculate TACoS weekly or monthly.
Then stop staring at it in isolation.
Read it beside:
- unit margin before ads
- ACoS by campaign or SKU
- organic sales share
- total sales trend
That combination tells a fuller story.
If TACoS is rising while sales and organic rank improve, you may be looking at a healthy investment period.
If TACoS is rising while margin thins and sales flatten, ads are carrying more of the business than they should.
If TACoS is falling because spend was cut faster than demand could hold, the ratio may look disciplined while the account is actually drifting backward.
That is the throughline to keep.
The formula is easy. The judgment is where operators separate themselves.
Use our PPC profitability calculator when you want the formulas in one place. If you want the broader metrics lens around what deserves attention and what deserves less panic, the 27 FBA business metrics that actually matter is still worth reading. If you need current cost assumptions that move with Amazon policy, check Amazon's own selling and fulfillment pricing guidance.
FAQ
How do you calculate TACoS for Amazon PPC?
Divide total ad spend by total sales and multiply by 100. If ad spend was $5,000 and total sales were $50,000, TACoS is 10%.
What is the difference between TACoS and ACoS?
ACoS uses ad-attributed sales in the denominator. TACoS uses total sales. ACoS helps you judge campaign efficiency. TACoS helps you judge how dependent the broader business is on paid traffic.
What is a good TACoS for Amazon PPC?
There is no benchmark that travels cleanly across every catalog. In our 210-business sample, 42.9% sat under 5% and 19.5% sat above 20%. Margin, growth stage, and operating model change what a healthy ratio looks like rather quickly.
Can TACoS be too low?
Yes. Sometimes low TACoS reflects strong organic demand. Sometimes it reflects underinvestment. In our sample, the lowest-spend group did not produce the highest average implied valuation multiple, which is a useful reminder that low spend and strong business quality are not the same thing.
Should you track TACoS by product or by account?
Both, if you can. Account-level TACoS shows how dependent the business is on paid traffic overall. SKU-level TACoS shows you where the spend is actually working and where it is quietly lighting money on fire.
Does TACoS matter during a product launch?
Yes, but you should read it differently during launch. Early on, a messy TACoS can be acceptable because you are buying visibility, ranking data, and early momentum. Once the product is established, the metric becomes much more revealing.
Curious what your business is worth?
Get a free, instant valuation and see how your Amazon business stacks up.
Get Your Free Valuation