How Much Is My Amazon Business Worth? Start With SDE, Then the Range
The FBA Guys
August 11, 2026
A seller doing $300,000 a year in Amazon sales sits at the median sales point in our positive-SDE valuation data.
That matters because the average answer and the useful answer are different. Among 8,643 positive-SDE valuation submissions in the FBA Guys database, the average valuation estimate was $1,302,754. The median was $214,508.
If you are asking, "how much is my Amazon business worth?", the practical answer is usually a multiple of trailing-twelve-month SDE. In our data, the median multiple was 2.54x, with the middle half of valuations running from 1.57x to 3.29x.
That range is wide for a reason. A $40,000 SDE business and a $700,000 SDE business don't trade on the same assumptions. A growing brand-registered business and a declining commodity catalog don't create the same buyer confidence.
The first job is to calculate the right earnings number. Then you can decide which range actually fits.
How Much Is My Amazon Business Worth? First Calculate SDE
Amazon businesses are usually valued from Seller's Discretionary Earnings, or SDE.
SDE is the earnings measure used for many owner-operated businesses. It starts with net income, then adds back valid owner benefits, one-time expenses, non-cash expenses, and other costs that won't carry forward to a new owner.
The formula looks simple: net income + valid add-backs = SDE, and SDE x valuation multiple = estimated business value. If you need to build the input first, start with the SDE calculator.
The formula is the easy part. The input is where the value moves.
If your P&L is on a cash basis, inventory purchases can land in the wrong period and change the SDE picture. That is one reason cash vs accrual accounting can change an FBA valuation. If you haven't captured legitimate add-backs, SDE can be too low. If you push add-backs that won't survive buyer review, SDE can be too high.
A $10,000 SDE error doesn't stay a $10,000 error. At a 3.0x multiple, it becomes a $30,000 valuation error.
That is why revenue is a poor substitute. Revenue tells you how much moved through the business. SDE tells you what the business produced for the owner after the real cost structure is considered.
What Multiples Are Realistic Right Now?
Across the 8,643 positive-SDE valuation submissions we analyzed, the median multiple was 2.54x. The average was 2.41x. The lower quartile was 1.57x and the upper quartile was 3.29x.
The distribution is useful because it keeps the conversation honest:
- 23.6% of valuations were under 1.5x.
- 11.8% were between 1.5x and 2.0x.
- 13.3% were between 2.0x and 2.5x.
- 13.9% were between 2.5x and 3.0x.
- 25.1% were between 3.0x and 3.5x.
- 10.4% were between 3.5x and 4.0x.
- 2.0% were 4.0x or higher.
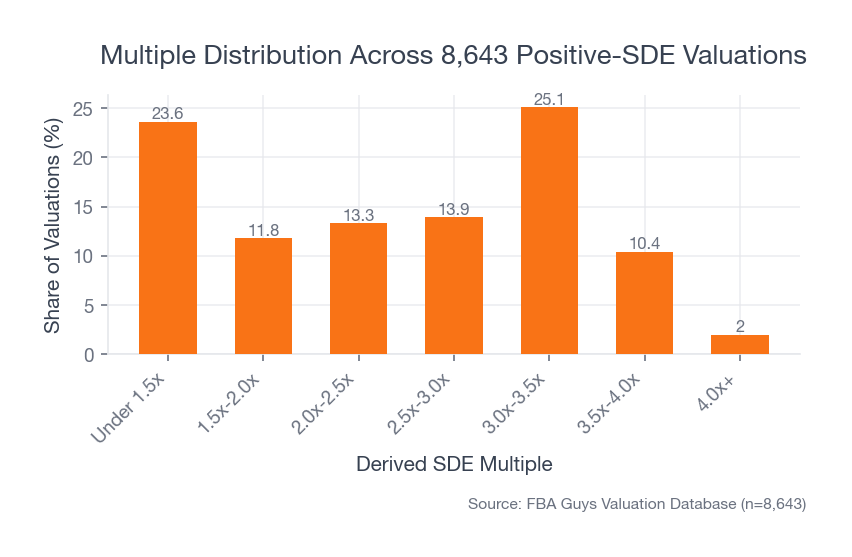 Source: FBA Guys Valuation Database (n=8,643)
The more useful finding is the distribution: 35.4% of the database sits below 2.0x while only 2.0% reaches 4.0x or higher. A single headline multiple skips that distribution.
A 4.0x Amazon business exists. It just isn't the default. A 2.0x business also exists, and it isn't necessarily broken. It may be small, young, concentrated, weakly documented, or carrying risk that buyers will price.
The SDE Band Is the First Filter
The best first filter in the database is SDE band. We break this down further in the separate data cut on FBA multiples by business size.
| Annual SDE band | Valuations | Median multiple | Middle 50% range |
|---|---|---|---|
| Under $50K | 3,120 | 1.97x | 1.15x-2.77x |
| $50K-$100K | 1,354 | 2.59x | 1.69x-3.28x |
| $100K-$250K | 1,574 | 2.85x | 1.88x-3.29x |
| $250K-$500K | 1,016 | 3.00x | 1.93x-3.30x |
| $500K-$1M | 766 | 3.11x | 2.17x-3.30x |
| $1M+ | 813 | 3.25x | 2.32x-3.33x |
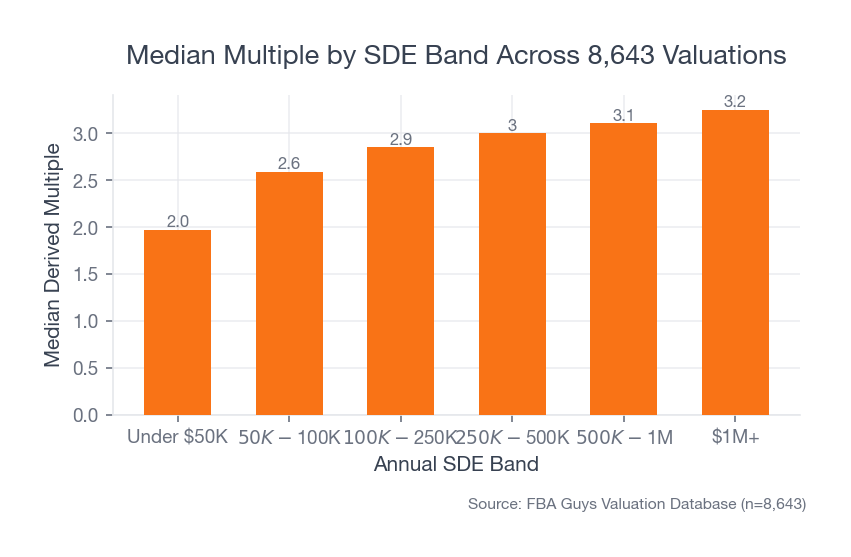 Source: FBA Guys Valuation Database (n=8,643)
The jump from under $50K SDE to $100K+ SDE is quite visible. Under $50K, the median was 1.97x. From $100K to $250K, it was 2.85x.
After that, the median keeps rising, but the range still matters. A $300,000 SDE business in the bottom quartile can estimate below a smaller business in the upper quartile. Size helps, but it doesn't finish the work.
This is why a seller doing $90,000 in SDE shouldn't simply borrow the multiple from a seller doing $800,000. The buyer pool, capital options, risk tolerance, owner workload, and documentation expectations are different.
The SDE band sets the first range. Business quality narrows it.
Why Revenue Alone Doesn't Answer the Question
The median sales figure in our positive-SDE data was $300,000. The average was $1,484,549.
That gap tells the same story as the valuation gap. The average is pulled upward by large businesses. The median is closer to what many operators are actually trying to understand.
Revenue gets especially misleading when margins split.
In one query, $1M+ revenue businesses with under 20% margin averaged $5.17M in sales, $522K in SDE, and a $1.07M valuation estimate. Businesses with $500K to $1M in revenue and 35%+ margin averaged $673K in sales, $324K in SDE, and a $907K valuation estimate.
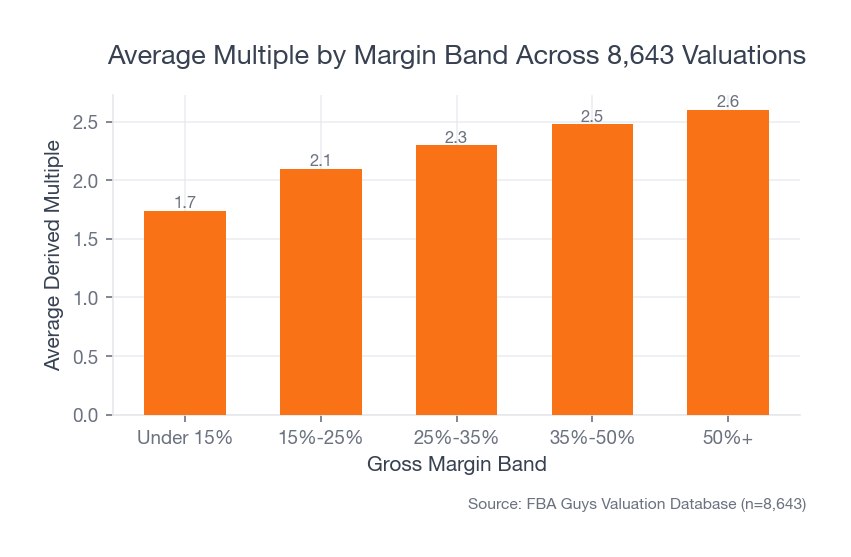 Source: FBA Guys Valuation Database (n=8,643)
The first group had more than seven times the revenue. The valuation estimates were much closer than that.
That comparison doesn't make the lower-revenue business better. The high-revenue group still averaged a higher valuation. But it shows why "I do $1M in sales" doesn't tell you what the business is worth.
The margin line, expense structure, add-backs, owner workload, and growth trend all sit between revenue and value.
Five Factors That Move Your Amazon Business Value
Once SDE is measured, the multiple is a buyer-confidence question. The useful variables are the ones that change confidence in the earnings after transfer.
The source framework for valuation looks at risk, growth, transferability, and documentation. For the broader framework, see the Four Pillars of an FBA valuation. The database doesn't capture every part of those categories, but it does show several useful signals.
1. Size
Size raises the median multiple in our data. The median multiple moved from 1.97x under $50K SDE to 3.25x above $1M SDE.
There is a practical reason for that. Larger businesses give buyers more earnings to analyze, more history to test, and often more room to hire help.
Size doesn't protect a weak business from scrutiny. It just gives the business more room to prove itself.
2. Growth
Growing businesses averaged 2.53x in our data. Stable businesses averaged 2.38x. Declining businesses averaged 1.98x.
The same pattern showed up inside SDE bands. From $100K to $250K SDE, growing businesses averaged 2.67x, stable businesses averaged 2.60x, and declining businesses averaged 2.26x. Above $500K SDE, growing businesses averaged 2.85x, stable businesses 2.69x, and declining businesses 2.37x.
Growth isn't only extra earnings. It changes the way a buyer reads the next twelve months.
If the business is growing, the buyer is underwriting a path. If it is declining, the buyer is underwriting a repair job. That is an inference from the data, not a law, but the pattern is consistent enough to pay attention to.
3. Defensibility
Brand Registry or trademark signals showed one of the clearest gaps in this dataset.
Businesses with a Brand Registry or trademark signal averaged 2.60x and $1,513,631 in valuation estimate. Businesses without Brand Registry averaged 1.81x and $636,217.
The gap held inside size bands. From $250K to $500K SDE, businesses with the signal averaged 2.80x. Businesses without it averaged 1.93x.
We don't know whether Brand Registry itself causes that gap. Our read is that the signal probably travels with other qualities: brand ownership, control of the listing, IP documentation, and a more defensible catalog.
That distinction matters. If you are eligible and haven't enrolled, the data says it deserves a look. If you aren't eligible, the deeper question is how else the business proves that the brand can be defended after transfer.
4. Documentation
Clean documentation doesn't show up as neatly in every valuation field, but it is central to the mechanics of a sale.
A buyer needs to verify revenue, gross profit, ad spend, SDE trends, inventory, supplier terms, contracts, and the tasks required to run the business. If those records are scattered or built on cash-basis timing that distorts inventory costs, the valuation conversation gets weaker before the multiple is even discussed.
This is also where add-backs matter.
A valid add-back increases SDE because it identifies a real owner benefit or non-recurring cost that won't carry forward. A weak add-back does the opposite of what the seller wants. It makes the earnings feel less reliable.
The documentation question is simple to ask and slow to answer: can a buyer follow the money and believe it?
5. Concentration And Transferability
Product concentration matters, but the data doesn't support treating it as the whole valuation story.
Top SKU 80%+ businesses averaged 2.33x. Top SKU 50-80% businesses averaged 2.36x. Top SKU 20-50% businesses averaged 2.50x. Top SKU under 20% businesses averaged 2.36x.
That is a narrower spread than many sellers would expect.
The more likely reading is that concentration needs context. A concentrated product line with strong margin, Brand Registry, clean books, and supplier continuity may be easier to understand than a scattered catalog with weak margins and no documentation.
Transferability is the bigger question. Can someone else take over the supplier relationships, account processes, SOPs, listing assets, ad accounts, inventory plans, and customer-service flow without your memory holding the process together?
If the answer is unclear, the buyer has to price the uncertainty.
How Inventory Changes the Number
Inventory can make two multiples look different when the dollars are closer than they appear. The presentation is part of the comparison.
For physical-product businesses, value can be presented as SDE x multiple plus the landed cost of good, sellable inventory on hand. It can also be presented with inventory included in the price. If you need the inventory piece, start with how to value inventory for Amazon FBA. The total economics can be similar while the visible multiple changes.
That is why you should compare total proceeds, not just the multiple.
The buyer will still care about inventory quality. Sellable stock, aged units, landed cost, stockout history, and working-capital requirements all matter. A warehouse full of slow-moving units doesn't behave the same as clean, current inventory that will sell through at normal margins.
The valuation data for this article doesn't resolve inventory treatment for your individual business. Treat the SDE multiple and inventory question as connected, then make sure the presentation is consistent.
A Quick Estimate You Can Run Before A Full Valuation
Use this as a rough estimate, not a sale price.
- Pull the trailing twelve-month P&L, preferably on an accrual basis.
- Calculate net income.
- Add back valid owner benefits, non-cash expenses, and one-time costs that won't carry forward.
- Put that SDE number into the closest SDE band from the table above.
- Use the middle range for that band, then move lower or higher based on growth, defensibility, documentation, transferability, concentration, and inventory treatment.
If the business has $160,000 in SDE, the relevant band in our data is $100K to $250K. The median multiple in that band was 2.85x, with the middle half running from 1.88x to 3.29x. That puts the rough estimate between about $301,000 and $526,000 before you decide how inventory is being handled.
The range is wide because the range is doing honest work. A calculator can narrow it. Clean inputs narrow it more.
When A Calculator Is Enough
A calculator is enough when you are trying to understand the rough shape of the asset.
It can tell you whether your Amazon business is more likely a $75,000 asset or a $750,000 asset. The FBA Guys valuation tool can show whether the multiple you heard from another seller is remotely in range. It can also show what a $20,000 improvement in SDE might be worth if the multiple stays the same.
The fuller valuation work matters when the inputs are no longer simple.
That usually means you are within a year or two of a possible sale, you have meaningful add-backs, you are unsure about cash vs accrual accounting, inventory is large relative to SDE, the business has a recent risk event, or a buyer is already asking questions.
The calculator gives a range. The deeper work tests the inputs.
What To Fix First
Start with SDE.
If the earnings number is wrong, every multiple conversation sits on top of a bad input. Clean up the P&L, make sure inventory accounting isn't distorting COGS, separate personal and business expenses, and build an add-back schedule that can survive review.
Then look at the confidence factors: growth trend, Brand Registry or trademark status, backup vendors, SOPs, workload, product concentration, and supplier continuity.
This order matters because the multiple only applies after the earnings number is credible. A stronger multiple on bad SDE doesn't help you. A clean SDE number gives the rest of the valuation somewhere solid to stand.
FAQ
Is an Amazon business valued on revenue or profit?
Amazon businesses are usually valued on SDE, not revenue. Revenue helps describe scale, but SDE shows what the business produced for the owner after expenses and valid add-backs are considered.
What multiple should I use for my Amazon business?
Use your SDE band as the first filter. In our database, the median multiple was 1.97x under $50K SDE, 2.85x from $100K to $250K SDE, 3.00x from $250K to $500K SDE, and 3.25x above $1M SDE. Then adjust for growth, defensibility, documentation, transferability, and risk.
Is inventory included in the value?
Sometimes inventory is shown separately and sometimes it is included in the listed price. The important part is consistency. Compare total proceeds and make sure the inventory number reflects landed cost of good, sellable inventory.
Can a small Amazon business still be worth selling?
Yes, if it has positive SDE and the buyer can understand what they are buying. Under-$50K SDE businesses in our data had a median multiple of 1.97x. Small size shapes the price, but it doesn't automatically erase value.
What is the fastest way to get a better estimate?
Calculate trailing-twelve-month SDE first. Then run the business through a valuation calculator with the best inputs you have. If the estimate matters because you are preparing for a sale, capital decision, or partnership discussion, the next step is to verify add-backs, inventory treatment, accounting method, and risk factors.
The Useful Answer Is A Range You Can Defend
The question "how much is my Amazon business worth" feels like it should have one number. It usually doesn't at the beginning.
The useful answer is a range built from SDE, size, growth, defensibility, documentation, transferability, and inventory treatment. In the FBA Guys data, the median multiple was 2.54x, but the SDE-band range tells the better story.
Under $50K SDE, the median was 1.97x. Above $1M SDE, it was 3.25x. In between, the quality of the business decides a lot.
Start with the SDE number. Then use the range that fits the business you actually have.
Curious what your business is worth?
Get a free, instant valuation and see how your Amazon business stacks up.
Get Your Free Valuation