Amazon Business Valuation Multiples: The Median Is Only the First Cut
The FBA Guys
August 13, 2026

A single multiple feels useful because it gives you something clean to multiply. That is also why it can get slippery so quickly.
Among 8,644 positive-SDE valuation estimates in the FBA Guys database, the median Amazon business valuation multiple is 2.54x. The middle half of the database runs from 1.57x to 3.29x, and only 2.0% of the pool reaches 4.0x or higher.
That range is useful, but the better answer starts one step later: first use the right SDE band, then decide where the business belongs inside that band.
SDE is seller's discretionary earnings, the earnings measure buyers use for many owner-operated businesses. In plain terms, it starts with net income and adds back valid owner benefits, one-time expenses, non-cash expenses, and costs that won't carry forward to a new owner.
What Amazon Business Valuation Multiples Actually Measure
The basic valuation math is simple:
Net income + valid add-backs = SDE
SDE x valuation multiple = estimated business value
For physical-product businesses, inventory can complicate how the price is presented. A business may be shown as SDE x multiple plus the landed cost of good, sellable inventory, or with inventory included in the list price. The visible multiple can look different while the total economics are closer than they first appear.
The multiple isn't the first number to solve. SDE is.
If SDE is off by $20,000, a 3.0x multiple turns that into a $60,000 valuation difference. The formula doesn't absorb a weak earnings number. It multiplies it.
This is especially true for Amazon sellers because inventory timing, cash vs accrual accounting, owner compensation, and add-backs can change the earnings base. A clean multiple on a messy SDE number still produces a messy valuation.
The Distribution Is Wide, and the Top Is Crowded
The current database midpoint is 2.54x, but the distribution is doing more interesting work than the median.
In the positive-SDE pool, 35.4% of valuation estimates are below 2.0x, while 37.5% are 3.0x or higher. The largest single bucket is 3.0x-3.5x, with 2,168 records, or 25.1% of the pool.
Then the distribution tightens fast: the 90th percentile is 3.58x, the 95th percentile is 3.61x, and only 175 of the 8,644 estimates reach 4.0x or higher.
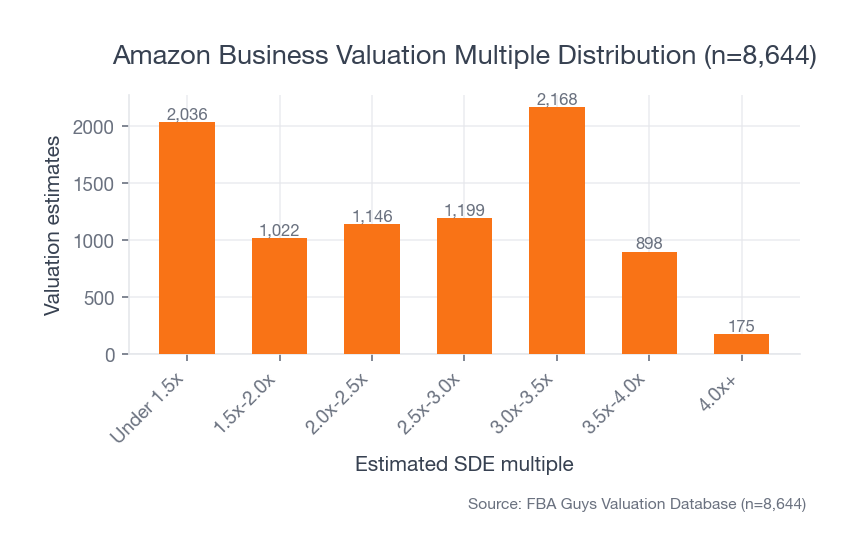 Source: FBA Guys Valuation Database (n=8,644 positive-SDE valuation estimates)
That is the odd shape of the market in our data. A 3x estimate isn't rare. A 4x estimate is a different thing entirely. The dedicated 4x multiple analysis goes deeper on that upper tail.
The distinction matters because a 3x business and a 4x business may sound close in casual conversation. In the database, they sit on opposite sides of a very narrow upper tail.
Start With the SDE Band
The SDE band gives the first serious filter. The FBA multiples by business size breakdown looks at this size curve more narrowly, and the same shape shows up here.
| Annual SDE band | Valuations | Median multiple | Middle 50% range | 4.0x+ share |
|---|---|---|---|---|
| Under $50K | 3,120 | 1.97x | 1.15x-2.77x | 0.9% |
| $50K-$100K | 1,354 | 2.59x | 1.69x-3.28x | 2.2% |
| $100K-$250K | 1,574 | 2.85x | 1.88x-3.29x | 2.4% |
| $250K-$500K | 1,016 | 3.00x | 1.93x-3.30x | 2.7% |
| $500K-$1M | 766 | 3.11x | 2.17x-3.30x | 2.6% |
| $1M+ | 814 | 3.26x | 2.32x-3.33x | 3.9% |
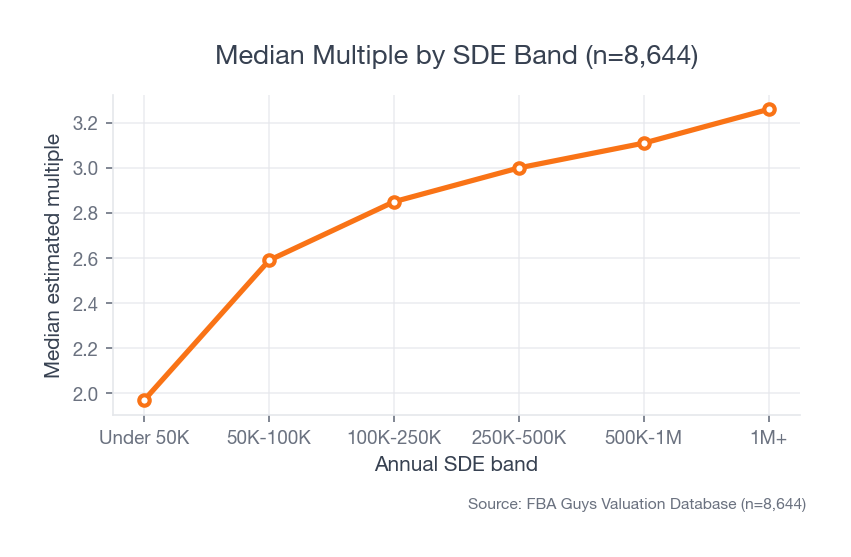 Source: FBA Guys Valuation Database (n=8,644 positive-SDE valuation estimates)
The first jump is the most visible. Under $50K SDE, the median is 1.97x; from $50K-$100K, it moves to 2.59x; from $100K-$250K, it reaches 2.85x.
After that, the climb continues but slows: $250K-$500K is 3.00x, $500K-$1M is 3.11x, and above $1M is 3.26x.
The useful finding isn't simply that bigger businesses get higher multiples. The data suggests the first few steps matter more than the later ones. Once a business clears the lower SDE bands, business quality still has a lot of room to move the estimate because the middle range remains wide.
A $300K SDE business in the bottom quartile can estimate below a smaller business in the upper quartile. Size helps. It doesn't finish the valuation.
For a seller sitting around $150K-$250K in SDE, this is the practical read: you are already in a band where the median approaches 3x, but that doesn't mean the business has earned the top of the band. The next questions are about margin, growth, defensibility, documentation, concentration, owner involvement, and inventory treatment.
Why 4x Is Still Rare
Size lifts the typical multiple. It barely changes how rare 4.0x+ is.
The 4.0x+ share is 0.9% under $50K SDE. It is 2.4% in the $100K-$250K band, 2.7% in the $250K-$500K band, and 3.9% above $1M.
That pattern changed our read a bit. We expected the upper tail to open more as businesses got larger. The median does move up with size. The 4x line remains hard to cross.
The percentile numbers explain why. P90 is 3.58x and p95 is 3.61x. The stretch between beating 90% of the database and beating 95% of it is only 0.03x.
Our read is that 4x should be treated as an exceptional estimate that the whole business has to support. It isn't the default target for a healthy Amazon operation.
The Quality Signals That Move a Business Within the Band
Once you know the SDE band, the next question is where the business belongs inside it.
In the database, one of the clearest quality gaps is Brand Registry or trademark status. Under $100K SDE, businesses with the signal averaged 2.35x. Businesses without a clear signal averaged 1.70x.
The $100K-$500K band is the cleaner comparison. Average SDE was almost identical: $235,623 with the signal and $235,590 without it. The average multiple was not identical: 2.77x with the signal and 1.94x without it.
Above $500K SDE, the gap was 2.90x vs 2.19x. The separate Brand Registry valuation gap article goes further into that signal.
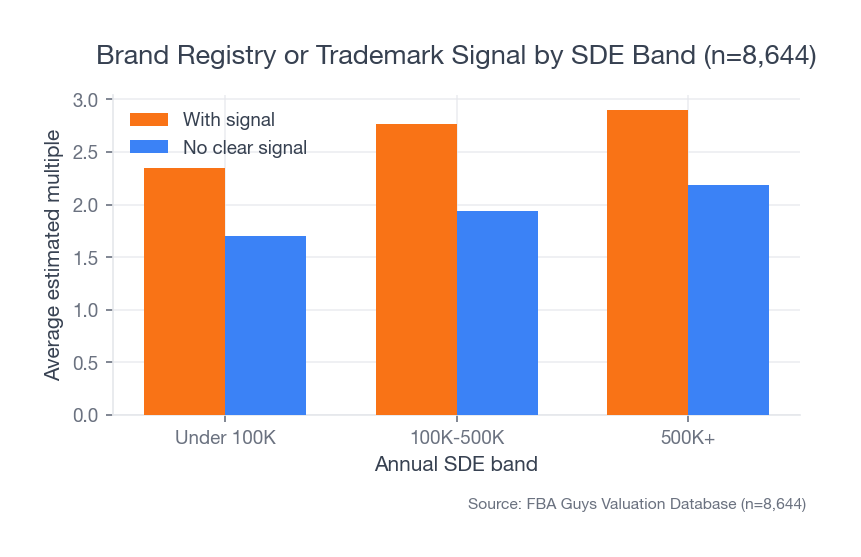 Source: FBA Guys Valuation Database (n=8,644 positive-SDE valuation estimates)
We don't know whether Brand Registry itself causes that gap. It may also travel with better products, better documentation, stronger supplier relationships, and more experienced operators. Still, as a valuation signal, it is quite visible.
Growth shows a more modest but consistent pattern. In the $100K-$250K SDE band, growing businesses averaged 2.67x, stable businesses averaged 2.60x, and declining businesses averaged 2.30x. Above $500K SDE, the spread was 2.85x, 2.69x, and 2.36x.
The sharper signal is decline. Stable businesses often sit closer to growing businesses than to declining ones. A buyer may not need aggressive growth to stay interested, but falling revenue narrows the room.
Margin has the same broad shape. Under 15% margin, businesses averaged 1.74x. At 50%+ margin, they averaged 2.60x.
None of these variables should be read alone. The more likely reading is that the higher-multiple business is easier to trust after transfer: cleaner earnings, stronger margin, more defensible products, less brittle growth, and fewer surprises for the next owner.
Revenue Can Send You Toward the Wrong Multiple
Revenue is useful context. It is a poor shortcut for valuation.
One database cut makes this plain. Businesses with $1M+ in sales and under 20% margin averaged $5.17M in sales, $522K in SDE, $1.07M in estimated value, and a 1.87x multiple.
Businesses with $500K-$1M in sales and 35%+ margin averaged $673K in sales, $324K in SDE, $907K in estimated value, and a 2.77x multiple.
The second group had about 13% of the first group's sales and still reached about 85% of its estimated value.
That doesn't make the smaller-revenue group better in every case. It shows why the multiple has to attach to earnings quality rather than top-line size. A high-revenue business with thin margins can leave less value than the sales line implies.
Concentration Matters, but It Doesn't Explain Everything
Product and supplier concentration still matter. The data just doesn't make them the whole story.
Single-supplier records averaged 2.39x, compared with 2.42x for the no/unknown group. Top SKU 80%+ records averaged 2.35x, compared with 2.43x for no/unknown. Backup vendors showed a clearer gap: 2.50x with backups vs 2.28x for no/unknown.
There is a limitation here. "No/unknown" mixes true no responses with incomplete responses, so this isn't a clean causal study.
The practical point is narrower. Concentration risk can still lower confidence, especially when a buyer can't see a credible backup plan. The stronger observed gaps in this article come from SDE band, defensibility, margin, and decline.
Concentration belongs in the valuation conversation. It shouldn't dominate it.
How to Use an Amazon Business Valuation Multiple
Use the multiple as a range-check, not as the first input.
First, calculate trailing-twelve-month SDE as cleanly as possible. If you need the earnings number before you use any multiple, start with the SDE calculator. Then place the business in the right SDE band and look at the middle range, not only the median. After that, decide where the business belongs inside the band.
That last step is where the real valuation work starts. Is revenue growing, stable, or declining? Are margins healthy? Is the brand defensible? Are the books clean enough for someone else to trust? Does inventory treatment change the visible multiple? Would the buyer inherit a business or a job that only you know how to do?
The multiple is useful when it disciplines those questions. It is less useful when it becomes the first number and every other input is forced to fit it.
FAQ
What multiple should I use for my Amazon business?
Use your SDE band first. In our data, the median was 1.97x under $50K SDE, 2.85x from $100K-$250K SDE, 3.00x from $250K-$500K SDE, and 3.26x above $1M SDE. Then adjust within that band for growth, margin, defensibility, documentation, transferability, concentration, and inventory treatment.
Are Amazon businesses valued on revenue or profit?
Amazon businesses are usually valued from SDE, not revenue. Revenue gives scale, but SDE shows what the business produces for the owner after expenses and valid add-backs are considered.
Is a 4x Amazon business valuation multiple realistic?
It is realistic for a small slice of businesses, but it is rare in the database. Among 8,644 positive-SDE valuation estimates, 175 reached 4.0x or higher, or 2.0% of the pool.
Does inventory count in the multiple?
It depends on how the valuation is presented. Some physical-product businesses are priced as SDE x multiple plus sellable inventory at landed cost. Others include inventory in the visible price. Compare the total economics, not only the displayed multiple.
Conclusion
The median Amazon business valuation multiple in our current positive-SDE valuation pool is 2.54x. That number is useful, but it isn't enough.
The more useful process is narrower and slower: calculate SDE, choose the right SDE band, then decide where the business belongs inside that band. Size sets the first range. Defensibility, margin, growth, documentation, concentration, and inventory treatment do the rest of the work.
A single multiple can orient you, but it shouldn't control the valuation.
Curious what your business is worth?
Get a free, instant valuation and see how your Amazon business stacks up.
Get Your Free Valuation