Amazon Seller Financial Dashboard Setup: Build the Monthly View Before the Dashboard Gets Pretty
The FBA Guys
April 20, 2026

The strange thing about most Amazon dashboards is how quickly they become decorative.
The owner logs in, sees sales, units, sessions, conversion rate, ad spend, maybe some inventory warnings, and feels informed for about twelve minutes. Then settlement timing changes. A shipment lands. PPC spend jumps. A wholesale order hits outside Amazon. The dashboard still looks alive, but the business is now asking a harder question.
What did we actually earn?
An Amazon seller financial dashboard setup should answer that question first. It should connect Seller Central sales, Amazon fees, refunds, ad spend, COGS, inventory movement, cash, and a monthly P&L into one owner view. The useful version is not a wall of charts. It is a repeatable close process that tells you whether the business made money, where cash went, and whether the numbers would survive a buyer, bookkeeper, CPA, or lender looking at them later.
The fact is, the dashboard matters because Amazon is very good at showing activity. Activity is not financial performance.
What an Amazon seller financial dashboard should actually answer
Start with the questions. The software comes later, and if you skip this part the prettiest dashboard in the world will still leave you guessing.
A good Amazon seller financial dashboard should answer seven questions every month: what were ordered sales, net sales, and collected cash; what did Amazon take in referral fees, FBA fees, storage fees, refunds, reimbursements, and other adjustments; what was true COGS for the units sold that month; what did ads cost and what did they buy; what happened to inventory value; what was operating profit before owner adjustments; and what was seller's discretionary earnings, or SDE, if you were looking at the business as an asset?
That last question is where many dashboards get thin. SDE is net income plus valid owner add-backs over a defined period. It is one of the main numbers used to value small owner-operated businesses, including Amazon FBA businesses.
Sales dashboards rarely get you there by themselves.
Seller Central can show ordered product sales, sessions, conversion rate, buy box percentage, payments, account health, and a lot of operational detail. Those are useful inputs. They are not a monthly P&L. They also don't tell you whether the cost attached to each unit sold was recorded on the same basis as the revenue.
Small difference. Expensive difference.
Start with the monthly close, not the software
The easiest way to make a dashboard useless is to build it before you know the month-end routine.
Here is the routine we would want to see before caring about charts: export or sync Seller Central sales and traffic data, pull payments and settlement details, pull advertising spend by campaign and product where possible, update inventory received and sold, post COGS on an accrual basis, reconcile cash received to deposits, produce a monthly P&L, and review add-backs separately from normal operations.
If that process does not exist, a dashboard can only decorate the confusion.
A spreadsheet can work at the beginning. QuickBooks or Xero can work. A2X, Sellerboard, InventoryLab, Fathom, or a custom Looker Studio report can work. The stack matters less than whether the same numbers close the same way each month.
We see this indirectly in the valuation data. Among valuation submissions with lower internal confidence scores, the average SDE proxy was about $310,000 and the average valuation was about $335,000. Among high-confidence submissions, the average SDE proxy was about $438,000 and the average valuation was about $1.43 million.
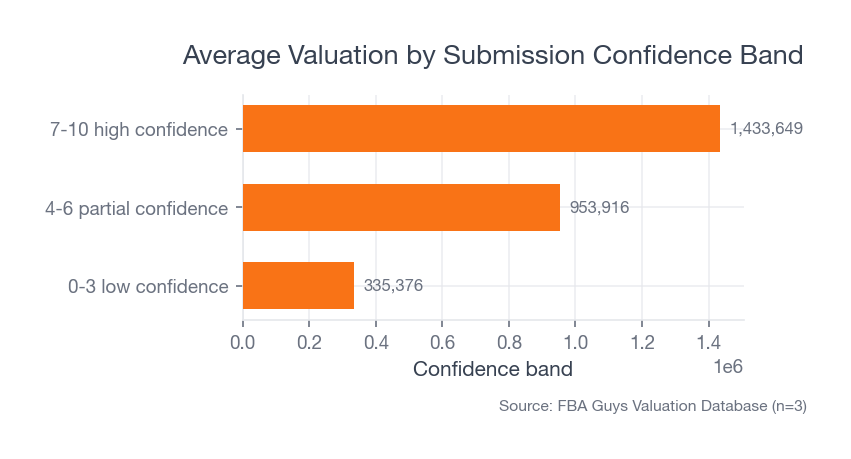 Source: FBA Guys Valuation Database (n=3 confidence bands)
That does not mean a dashboard created the higher value. It means clearer businesses tend to arrive with clearer economics.
There is a lesson in that for dashboard setup. The dashboard should reduce ambiguity. If it merely makes ambiguous numbers colorful, it has missed the job.
The seven numbers your dashboard needs
1. Net sales
Ordered sales are where most sellers look first. Fine. Keep them.
Then make the dashboard show the path from ordered sales to net sales. Refunds, promotions, tax handling, B2B pricing, and marketplace adjustments can all change what the business actually keeps.
This is where a Seller Central Business Reports view helps. It gives useful sales and traffic inputs by date and ASIN. The owner dashboard should bring those inputs into a monthly financial view instead of treating them as the final answer.
2. Amazon fees
Referral fees, FBA fulfillment fees, storage fees, placement fees, return processing fees, and subscription fees shouldn't sit in one blob called "Amazon fees."
That blob hides too much.
At minimum, separate selling fees, fulfillment fees, storage or inventory fees, refunds, reimbursements, and advertising. The point is not accounting elegance. The point is diagnosis. A margin problem caused by storage is not the same as a margin problem caused by discounting.
3. COGS tied to units sold
COGS is the dashboard line that causes the most quiet damage.
For an Amazon business, COGS should follow the unit sold. If you buy inventory in September and sell it in November, the cost belongs with the November sale. A cash-basis view can make a growing business look worse in one month and better in another simply because inventory purchasing moved around.
That is how a dashboard starts lying with accurate inputs.
Use landed cost per unit where possible: product cost, inbound freight, duties, packaging, inspection, prep, and other costs required to get the unit ready for sale. Then apply that cost when the unit sells. We covered the unit-level discipline in more detail in how to track COGS for Amazon FBA.
Not glamorous. Absolutely necessary.
4. Advertising spend and contribution margin
The advertising section should show more than ACOS.
ACOS is ad spend divided by attributed ad sales. TACoS is ad spend divided by total sales. Contribution margin looks at what remains after variable costs, including COGS, Amazon fees, and advertising. For financial control, contribution margin usually belongs closer to the owner dashboard than ACOS does.
Why?
Because a product can have a tolerable ACOS and still produce ugly cash flow after fees, returns, coupons, and landed COGS. The dashboard should show that before the bank account does.
5. Inventory value and inventory risk
Inventory has to appear twice: operationally and financially.
Operationally, you need units on hand, weeks of cover, reorder points, inbound shipments, stranded inventory, aged inventory, and stockout risk. Financially, you need inventory value, COGS released to the P&L, and inventory still sitting on the balance sheet.
The same units need to make sense in all three places: accounting records, Seller Central, and physical or FBA stock.
This is where dashboards get awkward. One report says units. One says dollars. One says available. One says reserved. One says inbound. Someone has a CSV named "final-final-inventory-April.csv" sitting in Downloads.
Leave room for awkwardness. The dashboard should have a reconciliation tab or section, even if it is ugly.
How to connect Seller Central, accounting, inventory, and ads
Think in layers.
The first layer is source data. You pull Seller Central Business Reports for sales, traffic, conversion, and ASIN-level performance; Seller Central Payments Dashboard and settlement reports for disbursements, fees, reimbursements, refunds, and adjustments; Amazon Ads for campaign spend and attributed sales; inventory and FBA reports for units, inbound shipments, reserved inventory, aged inventory, and fees; and accounting software for P&L, balance sheet, cash, liabilities, payroll, contractor costs, software, and owner adjustments.
The second layer is cleaning. Standardize SKU and ASIN names, map Amazon fee types into stable categories, map COGS by SKU, separate marketplaces and channels, and mark one-time expenses separately from recurring expenses.
The third layer is the owner view. You want sales, gross profit, contribution margin, operating profit, cash movement, inventory exposure, an SDE estimate, and a short list of exceptions requiring review.
Do this monthly before doing it weekly.
Weekly dashboards are useful for operating decisions. Monthly dashboards are where financial truth gets settled. If the monthly close is weak, the weekly view becomes a mood ring with decimal places. The same logic is why the Amazon seller profit and loss statement matters more than a single sales total.
A weekly Amazon seller dashboard rhythm
The weekly dashboard should be shorter than the monthly dashboard.
Oddly, that is where discipline shows up.
Each week, review ordered sales versus target, TACoS and contribution margin by product family, inventory weeks of cover, stockout risks in the next 30 to 60 days, aged inventory and storage fee exposure, refund rate and return reasons, buy box percentage and account health warnings, and cash expected from upcoming settlements.
One screen. Maybe two.
If the weekly view has forty charts, the owner will stop seeing the business. The useful question is simple: what changed enough this week that we need to act before month end?
For a mature seller, that weekly rhythm might trigger a reorder, a bid change, a price test, a coupon pause, or a cash transfer. For a smaller seller, it might simply prevent the familiar little disaster where the product is selling well, the dashboard looks green, and the next inventory order still cannot be funded without a credit card.
We have all seen some version of that. Competent operators, good products, decent sales, and a cash crunch hiding behind a pleasant revenue graph.
Common dashboard setup mistakes
Mistake 1: Treating settlement cash as profit
Amazon deposits are cash events. Profit is an accounting result. The settlement report is useful, but it needs context from the books. See how to read an Amazon settlement report for the report-level details.
A settlement can look strong because inventory was purchased last month, because refunds lagged, because ads have not cleared, or because tax and owner draws sit somewhere else. Your dashboard should show deposits, but it should not let deposits pretend to be profit.
Mistake 2: Building around vanity metrics
Sessions, conversion rate, unit session percentage, and BSR can be useful. They are not the financial spine of the business.
The owner dashboard should give those numbers a job. If conversion rate falls, what happened to contribution margin? If sessions rise, did your ad spend buy profitable demand or rented noise? If BSR improves, did your cash improve too?
Mistake 3: Leaving COGS manual for too long
Manual COGS works until it doesn't.
The breaking point usually arrives quietly: a new supplier, a freight change, a tariff change, a bundle, a multipack, a second marketplace, or a product refresh where old and new units overlap. If the dashboard cannot tell which cost belongs to which unit, every margin chart downstream becomes suspect.
Mistake 4: Mixing Amazon and non-Amazon channels
If Shopify, wholesale, Walmart, or retail revenue exists, split the dashboard by channel.
Mixed-channel reporting creates strange readings. Amazon might look less profitable because shared overhead is dumped there. Or it might look better because off-Amazon fulfillment costs sit elsewhere. Neither version helps the owner.
Mistake 5: Ignoring the exit view
Even if you aren't selling soon, the dashboard should keep an exit-quality trail.
In the valuation database, businesses with tax returns available showed a 2.66x average valuation-to-SDE proxy. Businesses without tax returns showed 2.09x. That is not a clean causal claim. Larger, more mature businesses are more likely to have tax returns available in the first place.
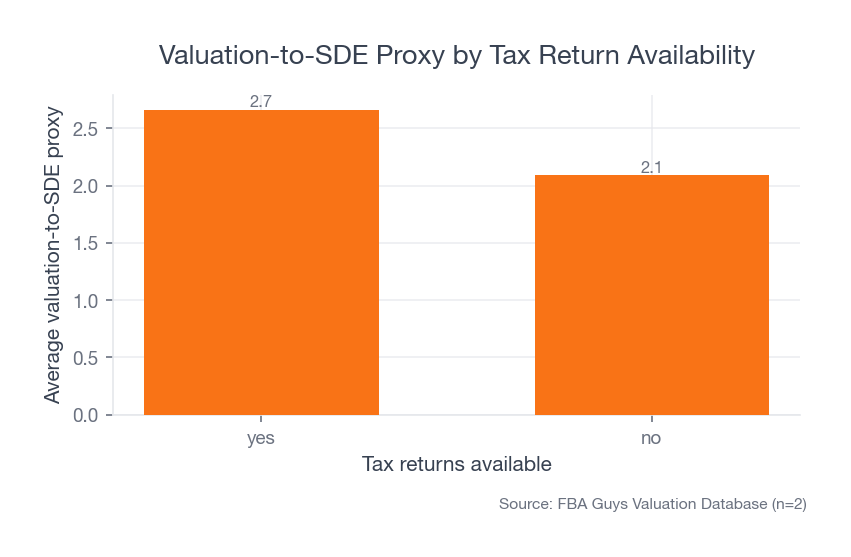 Source: FBA Guys Valuation Database (n=6,370 submissions with tax return availability)
Still, the pattern points in the right direction. Documentation and financial discipline travel together.
A practical setup sequence
Here is the simplest order, and it is deliberately plain because this is one place where cleverness usually creates extra work:
- Define the monthly close checklist.
- Decide the chart of accounts and fee mapping.
- Set SKU-level COGS rules.
- Reconcile Seller Central payments to bank deposits.
- Build a monthly P&L view.
- Add inventory value and weeks-of-cover.
- Add advertising efficiency and contribution margin.
- Add weekly exception reporting.
- Add an SDE estimate and add-back tracker.
The SDE estimate should be clearly labeled as an estimate. It is not a substitute for a full valuation, and it shouldn't pretend to be one. It is a discipline tool. It forces you to separate recurring operating expenses from valid owner add-backs, one-time expenses, and personal benefits. The mechanics are covered in how to calculate SDE for an Amazon business.
That one habit can change how the business feels.
Instead of waiting until a sale process, loan request, or tax deadline to assemble the story, the owner sees the story every month. The dashboard becomes less exciting, which is exactly the point.
What should the dashboard look like?
Use four tabs or sections: executive summary, product economics, inventory and cash, and close review with exceptions.
The executive summary should show sales, gross profit, contribution margin, operating profit, cash, inventory value, and SDE estimate. Product economics should show SKU or product-family performance. Inventory and cash should show weeks of cover, aging, inbound stock, storage exposure, and expected settlement cash. Close review should show unreconciled items, missing COGS, unusual fee spikes, refund changes, and add-back notes, because those are the little accounting pebbles that somehow end up in your shoe during a tax deadline or a sale conversation.
It does not need to be beautiful.
It needs to be boring enough that the same person can review it every month, and specific enough that a different person could understand where the numbers came from.
FAQ
What is the best dashboard tool for Amazon sellers?
The best tool is the one that supports your monthly close. A spreadsheet can be enough for a small seller with a few SKUs, especially if you know exactly where the inputs come from and who updates them. A larger seller will typically need accounting software, an Amazon connector, inventory tracking, and a reporting layer. The tool stack should follow the reporting process, not the other way around.
Should I use Seller Central as my financial dashboard?
Use Seller Central as a source, not as the whole dashboard. It is useful for sales, traffic, payments, account health, inventory, and advertising inputs. It doesn't replace an accrual P&L, inventory accounting, cash reconciliation, or SDE tracking.
Future link opportunity: an eventual dedicated article on Amazon seller dashboard software comparisons would be a natural link from the tool-selection FAQ.
How often should an Amazon seller update a financial dashboard?
Update operating metrics weekly and close financial metrics monthly. Weekly is useful for stockouts, ad spend, conversion, and cash warnings. Monthly is where COGS, fees, inventory value, P&L, and SDE should be reconciled.
What KPIs should be on an Amazon FBA dashboard?
Start with net sales, gross margin, contribution margin, TACoS, refund rate, FBA and referral fees, storage fees, inventory weeks of cover, cash from settlements, operating profit, and SDE estimate. Add product-level and channel-level detail only where it changes a decision, because you don't get extra credit for tracking a number nobody uses.
The dashboard is really a habit
The best Amazon seller financial dashboard setup is not the one with the most integrations. It is the one that makes the owner face the same financial questions every month.
What sold? What did it cost? What did Amazon take? What did ads buy? What happened to inventory? What cash moved? What would the business earn if someone else owned it?
Answer those questions consistently and the dashboard starts doing something useful. It stops being a screen you check when sales feel weird and becomes a record of how your business actually works.
Curious what your business is worth?
Get a free, instant valuation and see how your Amazon business stacks up.
Get Your Free Valuation