Amazon FBA Supply Chain Risk Management: Build the Reorder System Before It Breaks
The FBA Guys
June 17, 2026
Among 8,583 FBA business valuations with usable supplier data, the businesses with 2-5 suppliers averaged a higher value-to-SDE ratio than the businesses with one supplier, 6-10 suppliers, or 10+ suppliers.
That is interesting, but it isn't the whole supply-chain story. Amazon FBA supply chain risk management means knowing which supplier, inventory, cash, and documentation failure would interrupt the next profitable reorder, then building enough backup before that interruption reaches the sales line.
SDE means seller's discretionary earnings, the earnings measure commonly used to value owner-operated businesses. In this article, value-to-SDE means the valuation output divided by derived SDE.
The word "enough" matters because the data didn't reward supplier count forever. The 2-5 supplier group averaged 2.53 value-to-SDE, while the 10+ supplier group was much larger by average sales and averaged only 1.79. Our read is that the practical goal is building a reorder system that can survive a problem without becoming too complicated or too cash hungry.
What Amazon FBA Supply Chain Risk Management Means
For an FBA seller, supply-chain risk management starts with a plain question: what would stop your next profitable reorder from landing on time?
The answer might be a factory delay. It might be a price increase, a missed inspection, a late shipment, a customs problem, a slower Amazon receiving cycle, or a backup supplier that looked good in samples and fell apart at production volume.
It might also be your own inventory math.
Inventory feels like the solution to supply-chain risk. More inventory lowers stockout risk, at least for a while. It also ties up cash, increases the cost of a mistake, and makes every supplier decision more expensive to unwind.
So the better working definition is this: supply-chain risk management is the system that protects the next reorder without forcing the business to carry inventory it can't finance.
That system has six parts:
- Supplier readiness: who can produce the SKU, at what quality, and under what terms.
- Backup readiness: who can replace or support the primary supplier if something changes.
- Inventory discipline: how much stock the business carries relative to SDE and demand.
- Cash capacity: whether the next order can be funded without starving the rest of the business.
- Logistics visibility: how freight, customs, prep, and Amazon receiving affect timing.
- Documentation: whether another operator can understand and run the system.
The public Amazon supply-chain material is useful for program mechanics. As of the writing of this article, Amazon describes FBA, Amazon Supply Chain Services, Amazon Global Logistics, AWD, and related services as ways to manage transportation, storage, distribution, fulfillment, and delivery through Seller Central. Those tools can matter, but they don't remove the seller's need to know the risk inside each SKU.
Supplier Count Helps, Until It Stops Helping
The simple version of supplier diversification says one supplier is risky and more suppliers are safer.
There is truth in that. In the FBA Guys valuation database, one-supplier businesses averaged 2.39 value-to-SDE. Businesses with 2-5 suppliers averaged 2.53. They also carried a lower average inventory-to-SDE burden: 67.2% versus 78.4% for one-supplier businesses.
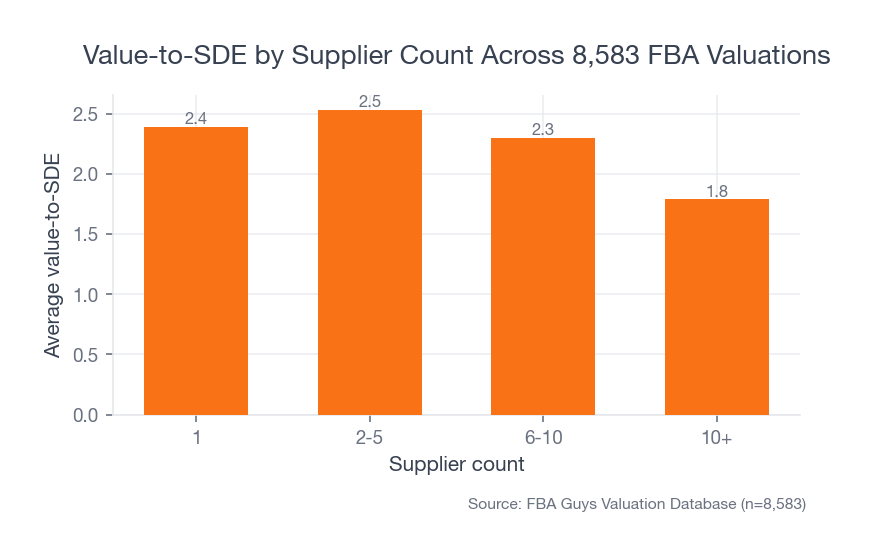 Source: FBA Guys Valuation Database (n=8,583).
That fits the common-sense version of the risk story. A business with several supplier relationships usually has more options than a business that depends entirely on one factory.
Then the pattern bends. Businesses with 6-10 suppliers averaged 2.30 value-to-SDE. Businesses with 10+ suppliers averaged 1.79, even though those 10+ supplier businesses were far larger by average sales at $4,093,924.
We don't know why from the supplier-count field alone. The 10+ supplier group may include businesses with many SKUs, more wholesale or reseller behavior, heavier operational overhead, category differences, or a lot of low-margin purchasing complexity. The database doesn't store enough supplier-level detail to isolate the cause.
That limitation is useful because it keeps the recommendation honest. If you have one supplier for a simple, defensible product and a tested backup ready, adding five more suppliers may only add communication, quality-control, payment, and forecasting work.
The better question is which supplier failure would actually hurt this business, and how ready the replacement is.
Backup Vendors Are the Cleaner Signal
Backup-vendor readiness changed the supplier-count picture more than raw supplier count did.
Across 8,583 usable records, businesses with backup vendors averaged $1,868,249 in sales, $570,097 in derived SDE, and 2.50 value-to-SDE. Businesses without backup vendors averaged $919,577 in sales, $299,635 in derived SDE, and 2.28 value-to-SDE.
That doesn't prove backup vendors caused the difference. Larger and better-run businesses may simply be more likely to have backups. Still, the cross-tab is hard to ignore because the backup pattern shows up inside the supplier-count bands.
Single-supplier businesses with no backup averaged 2.31 value-to-SDE. Single-supplier businesses with a backup averaged 2.53.
Two-to-five supplier businesses with no backup averaged 2.35. Two-to-five supplier businesses with backups averaged 2.62.
Six-to-ten supplier businesses with no backup averaged 2.03. Six-to-ten supplier businesses with backups averaged 2.37.
Even the 10+ supplier group improved from 1.61 without backups to 1.85 with backups, though that group still lagged the simpler supplier structures.
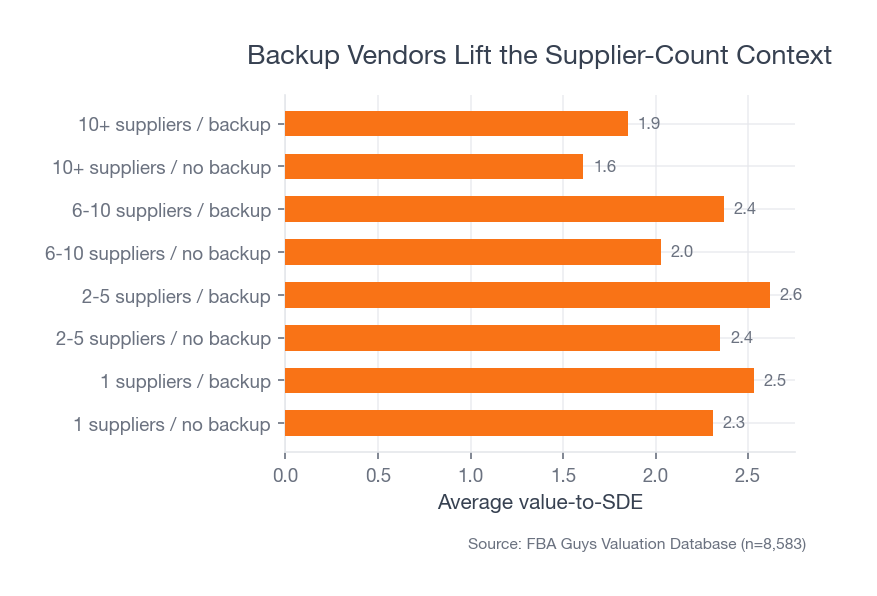 Source: FBA Guys Valuation Database (n=8,583).
The more likely reading is that backup readiness is a better operating signal than supplier count by itself. A single supplier plus a tested secondary source can be a more coherent system than six suppliers with no one clearly responsible for the top SKU if the primary source fails.
The word "tested" is doing real work here. A backup vendor isn't a spreadsheet row with a quote from two years ago. A backup vendor has produced samples that passed inspection, understands the packaging and compliance requirements, can hit the required lead time, and has current pricing that preserves the SKU's contribution margin. This is where supplier negotiation tactics and backup-vendor qualification start to overlap.
If the backup vendor can't produce at volume, it is a lead, not a backup.
Inventory Burden Is Where Supply-Chain Risk Becomes Valuation Risk
The supplier system matters most when it is paired with sane inventory economics.
Among 8,583 records, businesses with inventory below 15% of derived SDE averaged 2.70 value-to-SDE. The 15-50% group averaged 2.58. The 50-100% group averaged 2.32.
Then the drop got sharper. Businesses with inventory equal to 100-300% of derived SDE averaged 1.55. Businesses above 300% averaged 1.46.
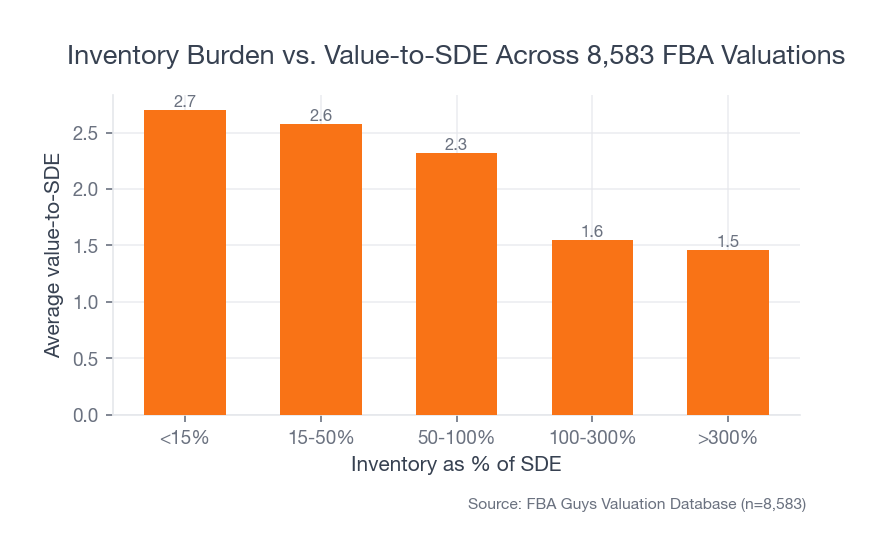 Source: FBA Guys Valuation Database (n=8,583).
This is where supply-chain risk management becomes less glamorous and more useful. A seller can reduce stockout risk by carrying more inventory. For a while, that may be sensible. The problem begins when the inventory position gets so heavy that the business has to keep feeding cash into stock before the last purchasing decision has proved itself.
The backup-vendor cross-tab makes this more concrete.
Records with backup vendors and inventory below 15% of derived SDE averaged 2.80 value-to-SDE. Records with backup vendors and inventory between 15% and 50% averaged 2.66. At 100-300%, backup-vendor records averaged 1.64. Above 300%, they averaged 1.51.
Backup vendors still helped. They didn't rescue the heavy-inventory bands.
The data keeps pulling the question back toward cash. Can the business place the next order, absorb a delay, test a backup, and still keep enough working capital for advertising, freight, storage, and ordinary operating expenses?
If the answer is no, the supply-chain system is already fragile.
That fragility may not show up in the sales chart right away. It often shows up as a set of small decisions: pushing a reorder too late, accepting a weaker quality-control process, declining a backup production run because cash is tight, or using air freight because the ocean plan missed the window.
None of those decisions lives in the database as a neat field. The inventory-to-SDE pattern is the closest proxy. It shows how quickly a physical product business can move from "we have inventory" to "inventory is controlling the business." The operating work is closer to Amazon FBA inventory management than a pure sourcing exercise.
Stockouts Still Matter
The inventory answer shouldn't drift into a lean-inventory sermon. FBA sellers know the other side of the problem: stockouts are expensive.
In the database, businesses that reported never stocking out averaged 2.60 value-to-SDE. Businesses that rarely stocked out averaged 2.51. Businesses that stocked out a few times per year averaged 2.36. Businesses that stocked out frequently averaged 2.00.
There is one complication. The "way too often" stockout group had only 47 records and averaged 2.40, so it is too small and too irregular to carry the argument.
The safer read is that frequent stockouts travel with weaker valuation context, but the data doesn't support a precise stockout formula. It doesn't tell us the lost sales from a specific ASIN, the rank impact, the recovery time, or the Amazon receiving delay that caused the problem.
That is fine. A seller doesn't need a perfect formula to ask the right operating question: which SKU would hurt most if it missed the reorder window by 30 days?
Usually that isn't every SKU. It is the highest gross-profit SKU, the one with the longest lead time, the one with a fragile supplier, or the one where the MOQ is large enough to distort cash.
Build the Risk Map SKU by SKU
The best supply-chain risk checklist starts with the top five SKUs by gross profit.
For each SKU, write down:
- Primary supplier
- Backup supplier
- Current unit cost
- MOQ
- Production lead time
- Payment schedule
- Freight path
- Landed cost
- Inspection step
- Reorder point
- Current inventory on hand
- Cash required for the next order
- Likely consequence of a 30-day delay
This turns "supply chain risk" from a vague concern into a visible operating map.
The first useful thing the map usually shows is concentration. Maybe one SKU is 60% of gross profit. Maybe one factory makes every profitable variation. Maybe the business has four suppliers, but they all rely on the same component. Maybe the domestic backup exists, but the unit cost would erase the SKU's margin if used for more than an emergency bridge.
The second useful thing it shows is timing. A supplier with a 30-day production cycle and a domestic freight path creates a different reorder problem than a supplier with a 70-day production cycle, ocean freight, prep, and a slow FBA receiving history.
The third useful thing it shows is cash. If the backup supplier requires a higher MOQ, the backup plan may need more working capital than the primary plan. That doesn't make the backup useless. It means the backup belongs in the cash plan before the primary supplier fails. The same logic shows up in minimum order quantity negotiation: the order size has to fit the business, not just the supplier's price break.
What Buyers Want to See Later
Supply-chain risk is also a transferability issue.
The Playbook's risk framework treats dependencies as a buyer-confidence problem. A business that depends on one SKU, one channel, one supplier, or one owner-specific relationship carries more perceived risk. The transferability framework adds a second layer: the manufacturer relationships and terms have to carry forward to the buyer.
If the buyer has to find a new manufacturer immediately after buying the business, perceived risk goes up.
That doesn't mean you need a formal contract with every factory. In many FBA businesses, the useful evidence is more practical: purchase-order history, payment terms, landed-cost calculation, supplier emails, inspection reports, packaging specs, product files, and proof that the supplier relationship isn't trapped in the owner's inbox.
Documentation matters because it lowers the number of things the buyer has to take on faith.
For an inventory business, the financial documentation matters too. Inventory purchases can distort SDE if they are handled on a cash basis. Accrual accounting helps show what the business actually earned, rather than when inventory cash left the bank account. That becomes especially important if freight, duties, prep, and landed-cost changes are part of the supply-chain risk story. For a deeper cost view, see the FBA freight-forwarding breakdown.
If you plan to sell someday, your supply-chain file should make three things obvious:
- The current supplier system can keep the profitable SKUs available.
- The inventory position is sellable, usable, and not wildly out of proportion to earnings.
- The next owner can understand the reorder process without needing the seller's memory.
Use Amazon Programs as Tools, Not as the Whole Risk Plan
As of the writing of this article, Amazon's seller-facing materials describe Amazon Supply Chain Services as a way to manage transportation, storage, distribution, fulfillment, and delivery. Amazon Global Logistics, AWD, FBA, and related programs may be useful pieces of an FBA seller's supply-chain plan.
They are still pieces.
Amazon can help with parts of transportation, storage, and fulfillment, depending on the program and the seller's eligibility. It doesn't choose your supplier, negotiate your MOQ, preserve your gross margin, inspect your production run, decide whether your backup vendor is real, or make your SKU-level cash math work.
Use Amazon-owned materials for current program mechanics because those mechanics change. Amazon's inventory management overview is a better current reference for active program language than any static blog post. Then bring the question back to the SKU: does this service reduce a specific risk in timing, cost, storage, fulfillment, or cash?
If it does, it belongs in the plan. If it only makes the system feel more sophisticated, it may not reduce the risk that matters.
A Practical 30-Day Supply-Chain Risk Project
If you only have time for one project this month, build the top-five SKU risk map and pick the weakest row.
A good first project is usually one of these:
- Get a real quote from the backup supplier for the top SKU.
- Run a paid sample or small production test with that backup supplier.
- Recalculate landed cost with freight, duty, prep, and Amazon receiving assumptions included.
- Rewrite the reorder point using current lead time and sales velocity.
- Move supplier terms, purchase orders, product specs, inspection notes, and packaging files into one folder.
- Compare cash required for the next two reorders against cash available after ordinary operating expenses.
The project should end with a decision, not a prettier spreadsheet. A supplier is ready or not ready. A reorder point is current or stale. A landed-cost number includes freight and duty or it doesn't. A backup production run is funded or it isn't.
Supply-chain risk management gets useful when it forces that kind of clarity.
FAQ
What is Amazon FBA supply chain risk management?
Amazon FBA supply chain risk management is the process of identifying the supplier, inventory, logistics, cash, and documentation risks that could interrupt profitable inventory flow into Amazon's fulfillment network.
Is a single supplier bad for an FBA business?
A single supplier is a risk signal, not an automatic valuation problem. In our data, single-supplier businesses with a backup vendor averaged 2.53 value-to-SDE, compared with 2.31 for single-supplier businesses without a backup.
How many backup suppliers should an Amazon seller have?
The practical minimum is one tested backup for any SKU that can materially hurt revenue or gross profit if it stocks out. Larger catalogs may need more, but the function matters more than the count.
Does carrying more inventory reduce supply-chain risk?
Only up to a point. More inventory can reduce stockout risk, but heavy inventory burden showed much weaker valuation context in the FBA Guys database. The article's key question is whether the business can keep stock available without tying up more cash than the business can support.
Should I use Amazon Supply Chain Services?
Possibly. Amazon Supply Chain Services, FBA, AWD, and Amazon Global Logistics may help with transportation, storage, fulfillment, and replenishment. The decision should come from a SKU-level risk map, not from the program name alone.
Curious what your business is worth?
Get a free, instant valuation and see how your Amazon business stacks up.
Get Your Free Valuation