True Cost of Selling on Amazon FBA: The Fee Table Is Only the Receipt
The FBA Guys
May 12, 2026

Amazon FBA costs look tidy when you first line them up.
Referral fee. Fulfillment fee. Storage. Maybe inbound placement. Maybe returns. The list feels manageable because each charge has a name, and named things are comforting. You can put them in rows. You can color the cells. You can convince yourself the business is under control because the spreadsheet has borders.
The true cost of selling on Amazon FBA is the full cost of turning one unit into kept profit: product cost, freight, duties, referral fees, FBA fulfillment fees, storage, placement, returns, advertising, prep, packaging, inventory cash, and the operating expenses needed to keep the machine moving. The fee table matters. The harder work is seeing whether the unit still produces durable earnings after all of those costs take their turn.
That is where a lot of FBA math gets quieter than it should.
What "True Cost" Means for an FBA Seller
The true cost of FBA isn't a single Amazon charge. It is the distance between gross margin and owner earnings.
Gross margin tells you what is left after the product-level cost of goods. Seller's Discretionary Earnings, or SDE, is the earnings stream a small owner-operated business is typically valued on: net income plus appropriate owner add-backs. Between those two numbers sit the costs that make Amazon businesses fascinating and occasionally maddening.
Some are explicit. Amazon's pricing page lists selling-plan fees and referral fees, and its Fulfillment by Amazon materials describe fulfillment, storage, returns processing, removal, disposal, and other service costs as current fee categories. Those pages are the right source for live mechanics because Amazon changes the rules.
Some costs are quieter. Advertising that was supposed to support launch becomes the only way the product stays visible. Inventory that was supposed to turn in eight weeks sits long enough to make storage feel personal. A prep change adds 38 cents per unit, which sounds laughable until the product sells 18,000 units a year and nobody updated the reorder sheet.
Honestly, this is why "what does FBA cost?" is a less useful question than it appears.
The better question is: what does this SKU cost after the sale survives contact with the whole business, rather than only the fee table?
The Visible Amazon Fees
Start with the visible layer because you still have to get it right.
As of the writing of this article, Amazon's public pricing and FBA pages describe several fee categories sellers need to model before deciding whether a product works:
- Selling plan fees
- Referral fees
- FBA fulfillment fees
- Monthly storage fees
- Aged inventory charges
- Inbound placement costs
- Returns processing
- Removal, disposal, or liquidation charges
- Optional prep, labeling, and related service fees
Each one deserves a real row in your unit economics model. The current rate should come from Amazon, not from a blog post you found six months after it was written. That includes this one.
The mistake is treating the fee list as the whole cost stack. It is only the part Amazon is willing to name for you.
What about the ad spend required to produce the sale? What about the inventory cash required to avoid stockouts? What about the slow SKU that technically has a good gross margin but needs too much capital sitting in FBA to earn it? What about the return that comes back unsellable after the replacement PO has already gone out?
The fee table gives you line items. It doesn't tell you whether the business is becoming expensive to own. Our guide to Amazon FBA hidden costs breaks out several of those quiet categories in more detail.
Why Gross Margin Can Still Mislead You
Gross margin is useful. It is also incomplete.
In the FBA Guys valuation database, under-10% gross margin businesses averaged a 1.61 derived value-to-SDE ratio. Businesses over 40% gross margin averaged 2.57. That direction makes sense. More room at the product level usually gives the business more room to survive Amazon fees, ad pressure, freight changes, returns, and operational mistakes.
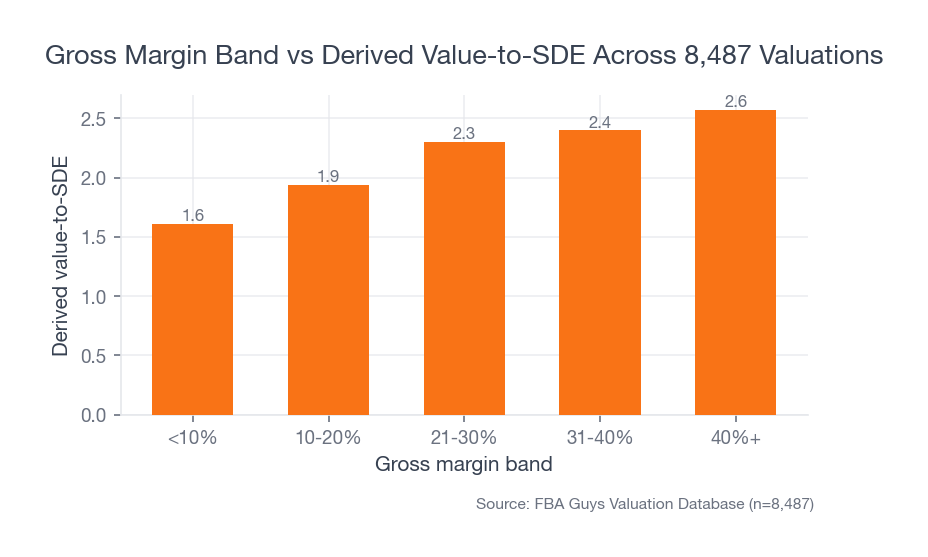 Source: FBA Guys Valuation Database (n=8,487)
The more interesting pattern appears when you look at the earnings layer. Businesses in the 0-5% SDE-margin bucket averaged 21.0% gross margin, 18.0% operating expense as a percentage of sales, and a 1.59 derived value-to-SDE ratio. Businesses with 30%+ SDE margins averaged 59.9% gross margin, 7.1% operating expense as a percentage of sales, and a 2.57 derived value-to-SDE ratio.
The gross margin gap matters. The operating gap matters too.
A seller can stare at a 32% product margin and feel reasonably calm. Then ads run at 11% of sales, storage creeps up, returns are heavier than expected, the prep center adds a small fee, and the owner still needs software, bookkeeping, samples, photography, reimbursements support, and someone to answer the weird customer message that includes three blurry photos and no order number.
That last detail is not the main cost. It is the texture of the cost stack. FBA makes fulfillment cleaner, but it doesn't make the business frictionless. For a more formula-focused version of this same problem, see our guide on how to calculate Amazon FBA profit margin.
Inventory Is the Cost Multiplier
Inventory changes the meaning of every FBA fee.
A storage fee on a fast-moving, high-margin product is annoying. A storage fee on a slow-moving SKU with cash already trapped in the next purchase order is a different problem. The same charge can be a nuisance in one business and a warning light in another.
Our data keeps pulling us back to inventory burden. Businesses in the <15 inventory-to-SDE bucket averaged 57.1% gross margin, $46,109 in inventory, and a 2.70 derived value-to-SDE ratio. Businesses in the >300 bucket averaged 34.7% gross margin, $305,979 in inventory, and a 1.53 derived value-to-SDE ratio.
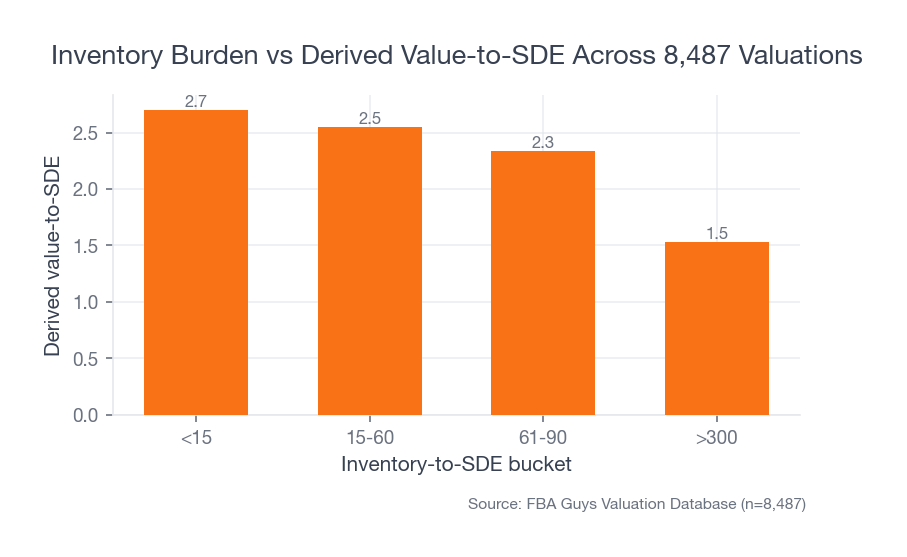 Source: FBA Guys Valuation Database (n=8,487)
That spread is too large to treat as a storage-fee footnote.
The fact is, a product can look profitable while the business becomes cash hungry. You reorder before the last shipment has fully proven itself. You carry extra units because the factory lead time is uncomfortable. You avoid a stockout, then pay Amazon to hold the optimism. Of course, some of that is normal in a physical-product business. The problem starts when the inventory requirement keeps growing faster than the earnings it supports.
FBA's convenience can hide that pattern for a while. The storage-fee breakdown goes deeper on why monthly storage and aged inventory charges are measuring different inventory problems.
SKU Count Changes the Shape of the Cost Problem
More SKUs can make a business stronger. More SKUs can also create more places for cost leakage to hide.
The database showed an interesting middle. One-SKU businesses averaged a 2.30 derived value-to-SDE ratio. Two to five SKUs averaged 2.44. Six to twenty SKUs averaged 2.69. Then the 21+ SKU group dropped to 2.23 while carrying $247,831 in average inventory.
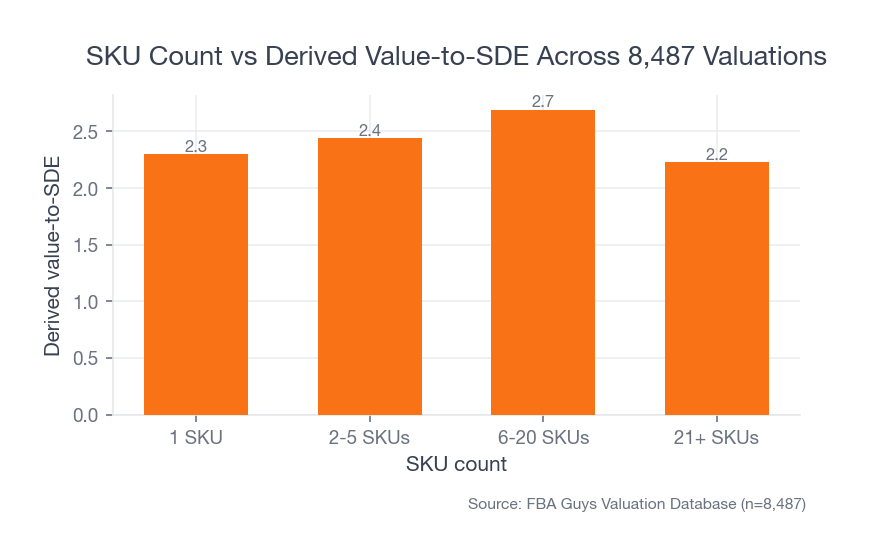 Source: FBA Guys Valuation Database (n=8,487)
That doesn't mean 21 products is bad. It means catalog breadth changes the job.
Each additional SKU brings its own referral category, size tier, packaging requirement, return behavior, ad profile, storage pattern, reorder cadence, and review risk. A tight catalog can make those variables manageable. A sprawling catalog can turn the monthly review into a scavenger hunt through reimbursements, stranded inventory, storage reports, ad campaigns, and the row in the spreadsheet labeled "Amazon Misc" because nobody wanted to break it apart after 10 p.m.
Is the sixth SKU the same kind of cost decision as the twenty-sixth?
Typically, no. The sixth might diversify a product line. The twenty-sixth might just be another small surface for fees, returns, and inventory drag.
How to Calculate Your Real FBA Cost per Unit
Use the unit as the starting point, then force the unit to carry its share of the business.
A simple model looks like this:
- Start with selling price.
- Subtract product cost, freight-in, duties, tariffs, inspection, prep, and packaging. Our landed-cost breakdown covers this layer.
- Subtract Amazon referral fee and FBA fulfillment fee using current Amazon rates. The fulfillment fee breakdown is useful here.
- Add inbound placement, monthly storage, aged inventory risk, returns processing, removal/disposal expectation, and reimbursement leakage where relevant. The inbound placement fee guide covers the shipment-plan side.
- Subtract advertising cost per unit sold.
- Allocate software, bookkeeping, VA support, photography, samples, compliance, and other operating costs in a way that reflects how the SKU actually consumes them.
- Compare the result to cash tied up in inventory and reorder timing.
That last step is the one too many models skip.
If a product produces $6 of contribution per unit but needs a deep inventory position, long replenishment cycles, and constant ad support, the unit may be profitable and still make the business fragile. If a lower-margin SKU turns quickly, needs little support, and stays clean on returns, it may deserve more respect than the gross-margin column gives it.
This is also where accrual accounting matters. A cash-basis P&L can make inventory purchases show up in the wrong period, which distorts the relationship between sales and cost. For an FBA business, landed cost should follow the unit into COGS when the unit sells. Otherwise, the P&L becomes a diary of payment timing, not a useful read on performance.
The Valuation Angle
The true cost of FBA eventually becomes a valuation question because buyers and valuation models care about earnings quality, not just revenue volume.
If costs are cleanly tracked, the story is easier to evaluate. If every Amazon charge rolls into a few vague expense accounts, the buyer has to guess where margin is leaking. If inventory is heavy relative to SDE, the buyer has to fund that operating need after close. If SKU economics are unclear, the buyer has to assume some of the catalog is weaker than the seller thinks.
That uncertainty has a cost.
The Playbook material is blunt on this point: online businesses are generally valued on trailing twelve-month SDE, and clean documentation helps buyers trust the numbers. The numbers need to support the story. If the business says it has strong margin, the P&L, inventory records, ad data, and Amazon reports should all point in the same direction.
A clean FBA cost model doesn't guarantee a higher multiple. It gives the business a better chance to be understood.
FAQ
What is the true cost of selling on Amazon FBA?
The true cost of selling on Amazon FBA is the full cost of creating kept profit from a unit: product cost, freight, duties, Amazon referral fees, FBA fulfillment fees, storage, inbound placement, returns, advertising, prep, software, labor, and inventory cash. The exact fee rates should be checked in Amazon's current pricing materials.
Are Amazon FBA fees the biggest cost?
Sometimes. In many products, COGS, advertising, freight, and inventory cash matter as much as the named Amazon fees. The named fee is easier to see. The business cost is often spread across several reports.
What FBA cost do sellers miss most often?
The cost most likely to be underestimated is inventory drag. It doesn't always arrive as one dramatic fee. It shows up through storage, aged inventory, slow cash cycles, larger reorders, stranded units, and weaker earnings quality.
How often should I update my FBA cost model?
Update it whenever Amazon changes fees, a supplier changes cost, freight moves materially, ad costs shift, packaging changes, or a SKU's sell-through rate breaks from the old assumption. Monthly is a reasonable operating rhythm for active sellers.
Curious what your business is worth?
Get a free, instant valuation and see how your Amazon business stacks up.
Get Your Free Valuation